
How Do Today’s Mortgage Rates Compare with History?
- Published on
- 11 min read
-
 Richard Haddad Executive EditorClose
Richard Haddad Executive Editor
Richard Haddad Executive EditorClose
Richard Haddad Executive EditorRichard Haddad is the executive editor of HomeLight.com. He works with an experienced content team that oversees the company’s blog featuring in-depth articles about the home buying and selling process, homeownership news, home care and design tips, and related real estate trends. Previously, he served as an editor and content producer for World Company, Gannett, and Western News & Info, where he also served as news director and director of internet operations.
For many homebuyers, the excitement of finding the right house quickly turns into questions about timing, affordability, and monthly payments. Mortgage rates can swing up or down depending on the economy, inflation, and what’s happening in the housing market, making today’s rates feel confusing. Looking back at mortgage rates history, how rates have risen and fallen over time can give buyers a valuable perspective on what’s considered “high,” “low,” or simply part of a normal market cycle.
How Much Is Your Home Worth Now?
Home values have rapidly increased in recent years. How much is your current home worth now? Get a ballpark estimate from HomeLight’s free Home Value Estimator.
Ultimately, it can help you feel more confident about whether now is the right time to buy, refinance, or make a move. Maybe you refinanced during the record-low pandemic-era rates and have been reluctant to give up that mortgage, even as life changes make a move feel necessary. Or perhaps you’re wondering if today’s rates are truly high or just closer to what buyers used to consider normal. Understanding how mortgage rates have changed over time can make today’s market feel a little easier to understand.


Jerome Leyba, a top-rated real estate agent in New Mexico, explains that there’s a natural ebb and flow to the market: “Interest rates go up, the market slows, they go down a little bit, and the market speeds back up.”
Let’s take a brief look at the economic factors that make rates go up or down. You may find things aren’t as bad as the headlines might lead you to think.
What causes mortgage rate fluctuations?
The Federal Reserve, inflation, and recessions have caused fluctuations in mortgage rates throughout history, but how? Think of each of these factors as pieces of a puzzle that, when combined, give some context to the average mortgage rate of a particular time period.
Federal Reserve
The Federal Reserve controls the country’s monetary policy. The primary goals of this government entity are to maintain stable prices and employment and set long-term interest rates. The Fed determines the rate at which banks will lend money to each other by setting what is called the federal funds rate. Maintaining stable prices means combating excessive inflation. The Fed will raise the federal funds rate to reduce the rate of inflation, and these higher rates are then passed on to consumers.
Inflation
Inflation occurs when prices rise, and your dollar doesn’t go as far — i.e., the grocery cart that cost $100 two weeks ago now costs $120, but you still only have $100 to budget for groceries. In response to growing inflation, interest rates rise across the economy to discourage unnecessary consumer spending. Demand for mortgage-backed securities drops, further causing rates to rise.
»Learn more: With inflation constantly shaking up mortgage rates, it’s smart to see how those changes could affect your future monthly payment before you buy. Try our mortgage payment calculator to get a quick, easy estimate of what your monthly mortgage could look like and start planning with confidence.
Bond market
Investors looking for low-risk but a return on their investments often find what they’re looking for in the bond market. Bonds are debt securities issued by either the government or corporations and sold to investors.
Banks and government-sponsored enterprises Freddie Mac and Fannie Mae often “bundle” mortgages together into mortgage-backed securities or “MBS.” They then sell these securities to the same investors that invest in the bond market, but they have to pay investors higher rates.
There’s more risk to an MBS, since if consumers default on the underlying loans and foreclosures rise, the security’s value declines. A higher rate of return incentivizes investors to assume that risk.
Recessions
The National Bureau of Economic Research states that a recession is defined by “a significant decline in economic activity that is spread across the economy and lasts more than a few months.” Related to this, unemployment often rises during a recession, which decreases demand for mortgages.
If you’re in a position to buy a home, that could be a good thing. Interest rates fall due to less demand. And, sadly, homeowners facing foreclosure due to unemployment are often more motivated to sell.
The economy
All of the above factors contribute to what people generally call “the economy.” If the country is in a recession, if the unemployment rate is rising, and inflation is up, pundits will say that the economy isn’t doing well. Whether or not the economy is “doing well” directly impacts mortgage rates, as we can see when looking at past decades.
Mortgage rates history
Was it cheaper for your parents or grandparents to buy a house? Looking back through the decades, mortgage rates have fluctuated over time. The difference in mortgage rates between buying a home in the 1970s versus buying in the 1950s could literally be thousands, if not hundreds of thousands of dollars over the life of the mortgage loan.
Here’s what you might have paid for a mortgage in past decades (and why) with data from Freddie Mac.
Mortgage interest rates 1974-2024
| Year | Average 30-year rate | Year | Average 30-year rate | Year | Average 30-year rate | Year | Average 30-year rate |
| 1974 | 9.19% | 1987 | 10.21% | 2000 | 8.05% | 2013 | 3.98% |
| 1975 | 9.05% | 1988 | 10.34% | 2001 | 6.97% | 2014 | 4.17% |
| 1976 | 8.87% | 1989 | 10.32% | 2002 | 6.54% | 2015 | 3.85% |
| 1977 | 8.85% | 1990 | 10.13% | 2003 | 5.83% | 2016 | 3.65% |
| 1978 | 9.64% | 1991 | 9.25% | 2004 | 5.84% | 2017 | 3.99% |
| 1979 | 11.20% | 1992 | 8.39% | 2005 | 5.87% | 2018 | 4.54% |
| 1980 | 13.74% | 1993 | 7.31% | 2006 | 6.41% | 2019 | 3.94% |
| 1981 | 16.63% | 1994 | 8.38% | 2007 | 6.34% | 2020 | 3.10% |
| 1982 | 16.04% | 1995 | 7.93% | 2008 | 6.03% | 2021 | 2.96% |
| 1983 | 13.24% | 1996 | 7.81% | 2009 | 5.04% | 2022 | 5.34% |
| 1984 | 13.88% | 1997 | 7.60% | 2010 | 4.69% | 2023 | 6.81% |
| 1985 | 12.43% | 1998 | 6.94% | 2011 | 4.45% | 2024 | 6.72% |
| 1986 | 10.19% | 1999 | 7.44% | 2012 | 3.66% | 2025 | 6.47% |
Source: Freddie Mac
Note of interest: While the 1981 average was 16.63%, interest rates peaked at 18.63% in October of 1981. Such a high rate significantly impacts a house payment. For example, a $400,000 mortgage at 18.63% would require a monthly payment of $6,234. That same loan at a pandemic-era rate of 2.65% would only require a $1,612 monthly payment.
Here’s how the past 50+ years of mortgage rates history look on a chart:
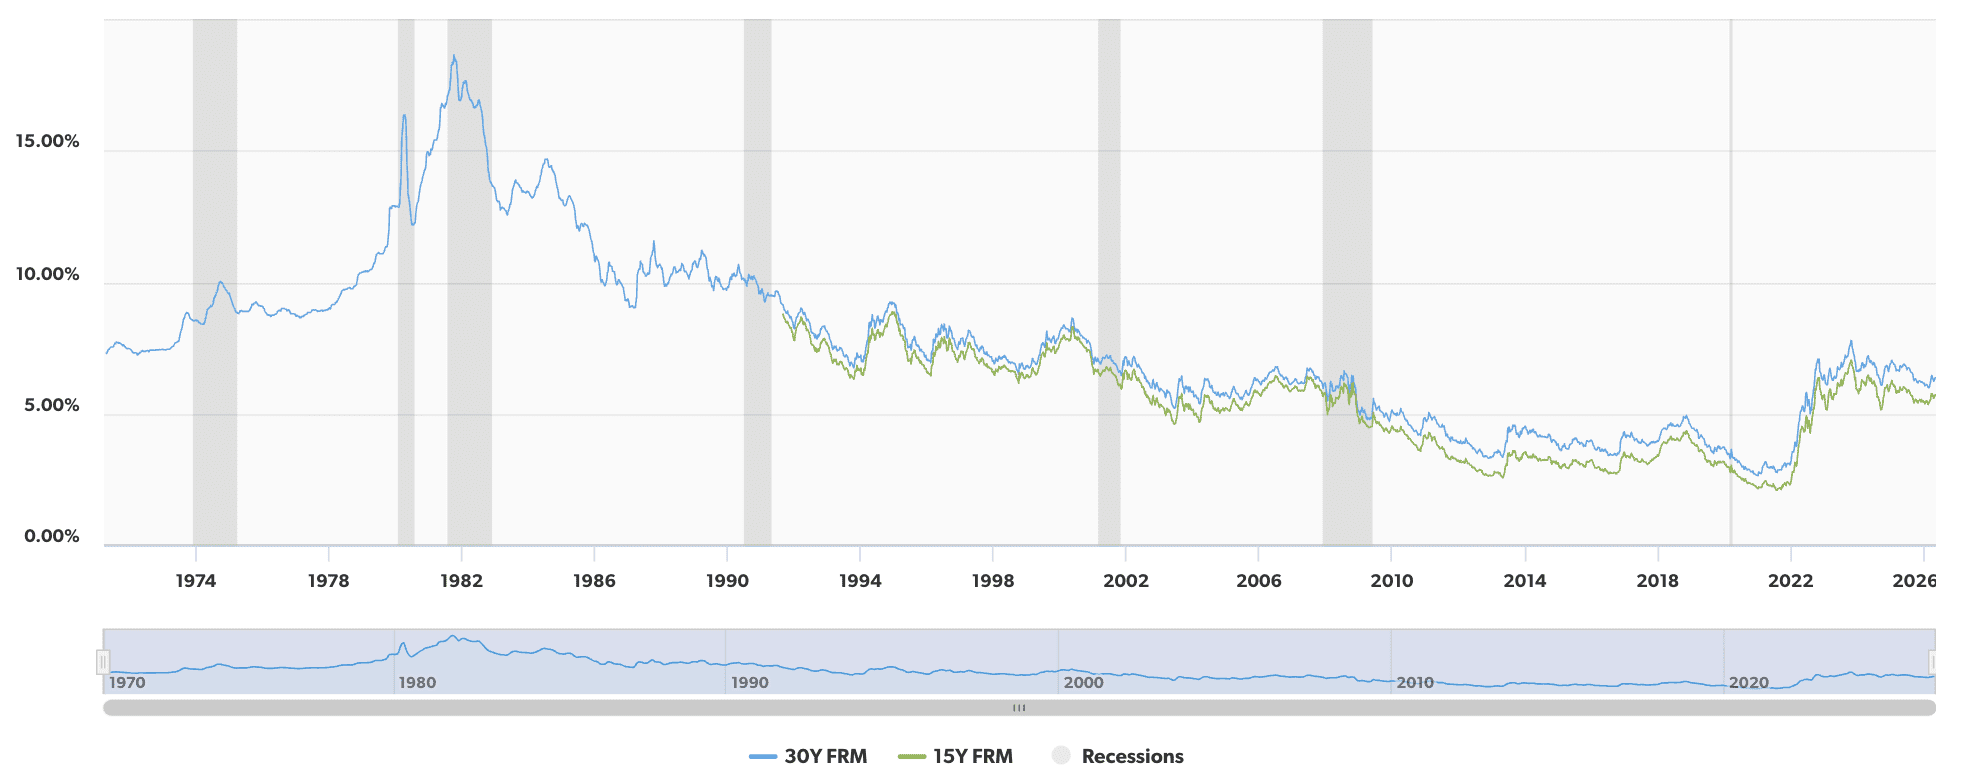
Mortgage rate trends then and now
In this section, we provide a brief overview of the trends that stood out in mortgage rates history.
Average mortgage rates in the 1970s: 7.38% to 11.20%
At the beginning of the decade, homeowners paid mortgage interest rates of around 7.38% to buy a home, but by the decade’s end, the rate had jumped to 11.20%! What caused the change? The 1973 oil embargo led to rapid inflation, which collided with layoffs and wage stagnation, causing what economists call “stagflation.” The result? Mortgage rates that reflected the lenders’ risk.
Average mortgage rates in the 1980s: 13.74% to 10.32%
In an attempt to curb inflation that continued from the 1970s into the 1980s, the Federal Reserve adopted a tight monetary policy at the beginning of this decade. Mortgage rates climbed higher after the Iran crisis in the late ‘70s, and high unemployment rates contributed to banks’ reluctance to lend.
Average mortgage rates in the 1990s: 10.13% to 7.44%
Potential homeowners could finally breathe a sigh of relief in the ‘90s. The country entered into a peaceful period after the Vietnam War of the 1970s, the Iran crisis, and the Gulf War of the 1990s. Inflation rates fell from over 5% to around 2% over the decade.
Average mortgage rates in the 2000s: 8.05% to 5.04%
Mortgage rates spiked again at the beginning of the 2000s before falling to a rate not seen since Freddie Mac began tracking them. The 2008 financial crisis, caused by low interest rates, subprime mortgages, and inadequate regulation, spurred the Federal Reserve to temporarily cut the Fed Funds Rate to zero. By the end of the decade, as the country recovered from the crisis, they rose again.


Average mortgage rates in the 2010s: 4.69% to 3.94%
It took more than a few years to recover, however. Demand for housing remained low during the 2010s and continued declining. At the beginning of 2010, 66.9% owned a home. That dipped to 63.4% in 2016, before ending the decade at 66.6%. Lower demand kept mortgage rates low as lenders tried to entice buyers into the market.
Average pandemic-era rates (2020-2022): 3.11% to 5.34%
Rates fell even lower in 2020 with the arrival of the COVID-19 pandemic. Leyba says that lower interest rates gave people incentives to purchase, “putting them in positions where initially, with interest rates before, they were unable to buy at specific price points, now they had flexibility and opportunity.”
The Federal Reserve kept interest rates low and also tried to stimulate demand by purchasing mortgage-backed securities. Banks, reassured that they could bundle their mortgages and sell them to the Fed, kept lending.
Despite these efforts, inflation rose sharply in 2022 and 2023, aggravated by supply-chain issues and the war in Ukraine. This led, indirectly, to a steady rise in mortgage rates, with 2022 capped off with a 30-year fixed rate of 6.42%.
Average post-pandemic-era rates (2023-2025): 6.6% to 7.0%
Mortgage rates were generally high and a bit unpredictable, especially compared to the record lows seen in 2020-2021. Rates peaked near 8% in 2023, stayed elevated through 2024, and eased slightly in 2025 but remained in the mid-6% range.
That meant higher monthly payments and affordability challenges for many buyers. Some homeowners held off on moving, while others looked for quicker or more flexible ways to sell. Overall, these years were marked by expensive borrowing costs and a slower housing market.
Current interest rate (2026): 6.2% to 6.5%
Mortgage rates in 2026 have been a little lower than what buyers saw from 2023 to 2025, but they’re still high compared to the low rates before and during the pandemic, mostly staying in the low-to-mid 6% range. Rates dipped close to 6% earlier in the year, giving buyers hope that borrowing costs were finally easing. But inflation concerns and higher Treasury yields pushed rates back up, with recent averages landing around 6.3% to 6.5%.
Monthly payments have become somewhat more manageable than during the 7%+ rate period. Still, according to HomeLight’s Lender Insights & Predictions Q2 2026, mortgage professionals say many buyers are holding onto the belief that rates will eventually fall back to pandemic-era lows, something experts view as unlikely in the near future and possibly even over the long term.
Some would-be buyers are delaying decisions in hopes of significantly cheaper borrowing costs down the road. But in reality, waiting for a big rate drop can mean missing out on homes being sold at a good price.
Overall, in 2026, rates are easing, borrowing has become slightly less expensive, and buyers holding off may be waiting for dramatic drops that may never come.
2026 and beyond predictions: Will mortgage rates go down?
Mortgage rates in 2026 and beyond are expected to move gradually rather than drop sharply. While short-term dips are still possible if inflation continues to cool, most experts don’t expect a return to the ultra-low pandemic-era rates.
For example, Fannie Mae forecasts mortgage rates averaging around 6.3% in 2026, suggesting rates may stay in a fairly narrow range rather than trending significantly lower. That means rates will likely continue to move up and down depending on economic data, Federal Reserve decisions, and bond market conditions.
Overall, the outlook points to steady rates rather than a long-term downward slide, keeping borrowing costs relatively stable but elevated compared to pre-2020 levels.
Buying or Selling? Start With a Top Agent
Connect with a top-rated local real estate agent for an expert opinion and to get the ball rolling. HomeLight analyzes over 27 million transactions and thousands of reviews to help you find the best agent for your needs.
Is now a good time to buy a home?
Whether now is a good time to buy a home really comes down to timing the market and your personal situation. With mortgage rates still sitting around the mid-6% range in 2026, borrowing is more expensive than what many buyers got used to a few years ago, but it’s also more stable than the 7%+ peaks seen recently. That means monthly payments are still a major factor in the decision, even if prices in some areas have started to level out or become more negotiable.
At the same time, broader market trends show things are shifting. After several years of tight inventory and rapid price growth, more homes are starting to hit the market in many areas, giving buyers a bit more breathing room. But affordability is still driving most decisions.
According to HomeLight’s Top Agent Insights Spring/Summer 2026 report, 61% of agents say monthly payment affordability is now the top factor buyers consider, far ahead of things like school districts, commute, or move-in condition. Many buyers aren’t just looking at sticker prices anymore. They’re focused on the full monthly cost, including rates, insurance, and taxes.
So, is now a good time to buy? For buyers who are financially ready and focused on long-term stability, today’s market offers more options and less competition than the peak frenzy years.
Since market conditions vary by city, state, and town, it’s always a good idea to speak to an expert agent in your area to get a feel for the local market. If you’re looking to buy soon, here are some tips.
- Get pre-approved for a mortgage: Mortgage pre-approval is important because it gives you a clear, realistic picture of what you can actually afford based on your income, credit, and debt, not just what you think you can afford.
- Save a larger down payment: With a larger down payment, you’ll pay less interest over time. Plus, it makes your offer more attractive to sellers.
- Shop beneath your maximum price: This can help you avoid becoming “house poor” if you spend all of your savings while purchasing your home.
Is now a good time to sell a home?
Now can actually be a pretty good time to sell, depending on your situation. Although mortgage rates are still in the mid-6% range and buyers are more cautious, there’s also less frantic competition from other sellers compared to the peak years. That can actually work in your favor if your home is priced right and shows well, since serious buyers still have fewer good options to choose from.
At the same time, buyers today are very focused on monthly payments, so homes that feel affordable on a monthly basis tend to get the most attention. Overall, it’s less about timing the market perfectly and more about whether selling now fits your goals and next move. If you’re thinking about selling soon, partner with an experienced agent to price your home strategically, attract the right buyers, and make the process as smooth as possible from listing to closing.
Decades of mortgage rate shifts
Mortgage rates have seen massive shifts over the decades, from the sky-high double-digit rates of the 1970s and 1980s, to the long stretch of relatively low borrowing costs in the 2000s and 2010s, to the more volatile pandemic and post-pandemic period. Each period has been shaped by different economic pressures, especially inflation, Federal Reserve policy, and broader financial conditions.
While today’s rates in the mid-6% range feel high compared to the recent past, they’re actually closer to long-term historical norms than the ultra-low pandemic-era years. What stands out most is how much rates influence buyer behavior, affordability, and overall housing market activity across every era.
If you’re thinking about buying or selling, HomeLight’s Agent Match tool can connect you with a top local real estate agent who can help you navigate your options in today’s market. HomeLight analyzes over 27 million transactions and thousands of reviews to determine which agent is best for you based on your needs.
Writer Dena Landon contributed to this story.
Header Image Source: (Curtis Adams/ Pexels)
- "Mortgage Rates", Freddie Mac (August 2024)
- "Average 30-year mortgage rate drops to lowest level in 15 months", CNBC News (August 2024)
- "Are We in a Recession? Analyzing the Current Economic Climate", Business Insider (August 2024)
- "Understanding The Federal Funds Rate", Forbes (July 2024)
- "U.S mortgage rates soar to highest in more than 23 years", Reuters (October 2023)
At HomeLight, our vision is a world where every real estate transaction is simple, certain, and satisfying. Therefore, we promote strict editorial integrity in each of our posts.