Average Cost to Sell a House Hits $31,000 on Average, Our Analysis Reveals
- Published on
- 9 min read
-
 Caroline Feeney Former Executive EditorClose
Caroline Feeney Former Executive Editor
Caroline Feeney Former Executive EditorClose
Caroline Feeney Former Executive EditorCaroline Feeney was previously HomeLight's Executive Editor / Director of Content. With 7 years of real estate reporting and editing experience, she previously managed content for Inman News and co-authored a book on real estate leadership. The Midwest native holds a master's from the Missouri School of Journalism and was formerly a real estate contributor for Forbes.
From 2019 to 2020, homeowner equity across the country increased 10.8%, according to a report from CoreLogic. That makes 2021 an opportune window for many people to sell a home and for a nice profit to boot. However, it will surprise some sellers — especially first-timers — to learn that selling a house is a massive undertaking with a ton of associated expenses.
Between home improvement projects, taxes, and commission fees, the cost to sell a house nationally tallies up to an estimated $31,308 on average, a recent study by HomeLight reveals. Thankfully, targeted home upgrades and a great agent’s expertise can add significant value and help you maximize your sale price.
Our analysis took into account median home prices, current housing industry fees and taxes, and recent home improvement cost data to estimate sale costs from pre-list to close countrywide and in 30 of the most populous U.S. metros.
We found that selling a house costs money no matter where you live, but factors like home prices, state policy, the cost of home services for the area, and local transaction customs can vary drastically between markets and ratchet up the cost to sell.
Dig into city-level data in the charts below, and keep reading for key takeaways and a breakdown of our full methodology.
| Metro Area | Median-Priced Home | Estimated Total Cost to Sell |
| National Average | $324,900 | $31,308 |
| San Francisco, CA | $1,390,500 | $111,084 |
| Seattle, WA | $735,000 | $66,420 |
| Washington, DC | $599,900 | $53,259 |
| San Diego, CA | $650,000 | $51,649 |
| Los Angeles, CA | $585,000 | $47,639 |
| Boston, MA | $625,000 | $47,606 |
| Riverside, CA | $500,000 | $42,525 |
| New York, NY | $513,000 | $39,981 |
| Denver, CO | $495,000 | $38,490 |
| Portland, OR | $435,000 | $36,075 |
| Austin, TX | $430,000 | $35,199 |
| Sacramento, CA | $395,000 | $34,154 |
| Miami, FL | $325,000 | $28,958 |
| Atlanta, GA | $350,000 | $28,558 |
| Chicago, IL | $330,000 | $27,065 |
| Phoenix, AZ | $318,500 | $27,746 |
| Las Vegas, NV | $306,000 | $27,306 |
| Orlando, FL | $312,000 | $27,152 |
| Dallas, TX | $303,000 | $26,197 |
| Philadelphia, PA | $280,000 | $26,014 |
| Charlotte, NC | $305,000 | $25,775 |
| Houston, TX | $252,000 | $24,625 |
| San Antonio, TX | $285,000 | $23,971 |
| Tampa, FL | $248,000 | $23,128 |
| Baltimore, MD | $224,000 | $21,444 |
| Pittsburgh, PA | $195,000 | $19,310 |
| Detroit, MI | $180,000 | $19,154 |
| Cincinnati, OH | $196,000 | $19,025 |
| Minneapolis, MN | $155,000 | $15,203 |
| St. Louis, MO | $155,000 | $14,891 |
Higher home prices hike up sale costs
Because many home sale fees are calculated ad valorem as a percentage of property value, the typical cost to sell a house can increase significantly in cities with higher-than-average home prices.
In San Francisco, for example, where the median home price is nearly $1.4 million, we estimated that it costs $111,084 to sell a house on average, over three times the national average. Seattle takes second place for the most expensive market to sell a home, with sellers spending an estimated $66,420.
By contrast, sellers in Minneapolis ($15,203) and St. Louis ($14,891) are the major metro markets where home sale costs trend the lowest on average.
Make sure your agent is worth their commission
Agent commission fees are generally the largest cost associated with selling a home. However, our data at HomeLight shows that the right real estate agent can make up for their commission rate and then some.
According to our home sales database, the top 5% of agents sell homes for as much as 10% more than the average real estate agent. That’s not to mention the countless hours they save sellers by handling offers, negotiations, and paperwork.
Taxes take a big chunk at closing
State and local policy can also increase the fees associated with selling a home. Real estate transfer taxes, a one-time fee levied on the sale as a percentage of property value and used to generate revenue for your state, county, or city (and sometimes all three) vary across the country.
For example, in our study, Washington, D.C. has the fifth highest home prices among the metro areas studied but ranks as the third most expensive metro with regard to selling costs. That’s largely attributable to the hefty tax of 1.45% imposed on D.C. sales of $400,000 or above, which sellers are typically on the hook to pay for.
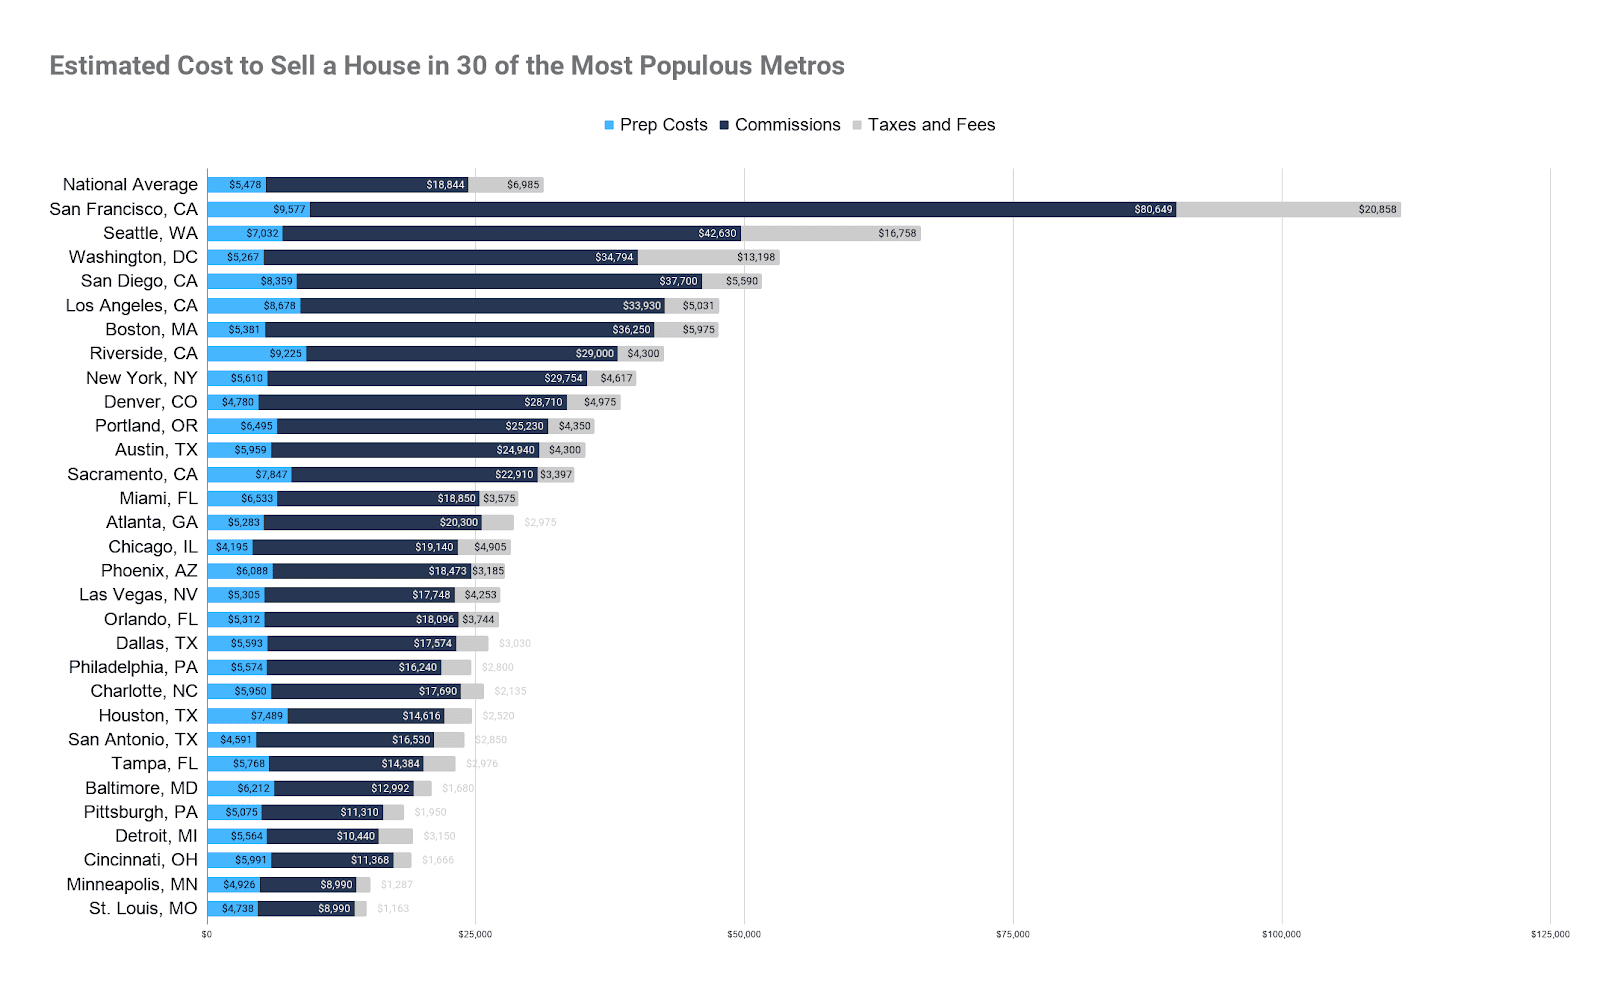
Don’t forget about home prep costs
When it comes to getting a house ready for sale, our study found that the top five most expensive metros for common pre-sale efforts like acquiring a dumpster, hiring for basic lawn care, and staging a home are all in California due to the Golden State’s high cost of goods and services.
These metros include San Francisco (where it costs an estimated $9,577 to prepare a home for the market), Riverside ($9,225), Los Angeles ($8,678), San Diego ($8,359), and Sacramento ($7,847).
Houston ($7,489), Seattle ($7,032), and Miami ($6,533) are also pricey places to whip a house into selling shape. Sellers in San Antonio ($4,591) and Chicago ($4,195) are in luck, though — in these metros, the cost of efforts like lawn care and staging are most affordable.
Thankfully, the money you spend to improve your home before putting it on the market can provide a great return on investment. Staging alone can increase a home’s sales price anywhere from 1%-20%, according to 67% of top agents we surveyed.
The couple hundred bucks you’ll spend on basic lawn care prior to listing will pay off in a big way, too. In fact, 91% of top real estate agents recommend caring for the yard prior to resale, an effort that on average will result in a $1,211 value increase or 352% ROI.
| Metro Area | Median-Priced Home | Total Estimated Home Prep Costs |
| San Francisco, CA | $1,390,500 | $9,577 |
| Riverside, CA | $500,000 | $9,225 |
| Los Angeles, CA | $585,000 | $8,678 |
| San Diego, CA | $650,000 | $8,359 |
| Sacramento, CA | $395,000 | $7,847 |
| Houston, TX | $252,000 | $7,489 |
| Seattle, WA | $735,000 | $7,032 |
| Miami, FL | $325,000 | $6,533 |
| Portland, OR | $435,000 | $6,495 |
| Baltimore, MD | $224,000 | $6,212 |
| Phoenix, AZ | $318,500 | $6,088 |
| Cincinnati, OH | $196,000 | $5,991 |
| Austin, TX | $430,000 | $5,959 |
| Charlotte, NC | $305,000 | $5,950 |
| Tampa, FL | $248,000 | $5,768 |
| New York, NY | $513,000 | $5,610 |
| Dallas, TX | $303,000 | $5,593 |
| Philadelphia, PA | $280,000 | $5,574 |
| Detroit, MI | $180,000 | $5,564 |
| National Average | $324,900 | $5,478 |
| Boston, MA | $625,000 | $5,381 |
| Orlando, FL | $312,000 | $5,312 |
| Las Vegas, NV | $306,000 | $5,305 |
| Atlanta, GA | $350,000 | $5,283 |
| Washington, DC | $599,900 | $5,267 |
| Pittsburgh, PA | $195,000 | $5,075 |
| Minneapolis, MN | $155,000 | $4,926 |
| Denver, CO | $495,000 | $4,780 |
| St. Louis, MO | $155,000 | $4,738 |
| San Antonio, TX | $285,000 | $4,591 |
| Chicago, IL | $330,000 | $4,195 |

The cost to sell isn’t one-size-fits-all
The cost to sell your home will vary based on the level of prep work required and which fees apply to your locale. Sellers looking for a more tailored estimate can input their information into HomeLight’s Net Proceeds Calculator, which will add up the costs based on your estimated home value.
To Calculate Your Selling Fees, Start With a Home Value Estimate
Tell us a little bit about your property and we’ll provide you with an instant home value estimate to use as a starting point.
Keep in mind, a conventional listing process isn’t right for everyone, either. For sellers in a hurry or who don’t have the upfront funds for home improvements, we recommend requesting a cash offer through our Simple Sale platform.
Through Simple Sale, we’ll match you with a cash buyer who specializes in your property and price point. You’ll also pay zero agent fees and get a fast closing. A home’s Simple Sale price is typically 90%-95% of market value — so we’ll also provide you with an estimation of what you could fetch on the open market with a top agent’s expertise for comparison.
Methodology
How our study was conducted:
Metro selection
We pulled the 30 most populous U.S. metro areas using data from the U.S. Census Bureau.
Median home prices
We collected median home price data at the national and metro level. For the national median home price cited in this study, we referred to the U.S. Census Bureau’s Q3 2020 report of Median Sales Price of Houses Sold for the United States. To gather median home prices at the metro level, we used HomeLight’s available transaction data for each city as shown on our local housing market overview pages and data from our partner site, U.S. News Real Estate.
Agent commissions
According to HomeLight’s Agent Commission Calculator, which uses real estate transaction data from thousands of home sales each year, the national average real estate commission rate is 5.8% of the sale price. This commission, paid for in total by the seller, is customarily split with the buyer’s agent responsible for bringing a buyer to the sale.
We applied the 5.8% rate to both the national and city level cost estimates. However, it should be noted that commission rates do vary by locale and can be negotiated.
Home prep costs
We then factored in costs for some of the most common pre-listing home improvements that sellers take on. We used HomeAdvisor’s True Cost Guide, collected from thousands of real customers, to input costs for dumpster rental, deep cleaning, interior painting, carpet installation, basic lawn care, and home staging* at the city and national level.
*Data for home staging wasn’t available for all locales. For any cities without local staging data, HomeLight pulled the statewide staging average. When no statewide average was available, we used the national average of $1,261.
Transfer taxes
States and municipalities levy “transfer taxes” for the transfer of property title from one party to another. To calculate a transfer tax cost estimate as close as possible for the local markets, we pulled transfer tax rates from each state’s legislative code and applied it to the metro’s median home price.
Currently, 13 states do not charge any transfer taxes, while these taxes can surge up to 3%-4% for homes over a million dollars in some states.
Note that, for the most part, our calculation does not account for any additional transfer taxes at the city or county level, which can vary. An exception to this is California, where most counties impose an optional tax at the same rate. San Francisco, however, has its own tiered tax rate based on property value that we factored in instead.
For the national level: A study from the George Washington Institute of Public Policy reported that state transfer tax rates range on average from 0.1%- 2.2%. We used an average 1.15% when calculating the estimated national average transfer tax on a median-priced home sale.
A few states specify that the seller must pay these taxes, although some are nebulous or say it’s negotiable between buyer and seller. We consulted First American Title’s guide to Real Estate Customs By State for guidance.
In states where the seller customarily covers transfer taxes, we applied the full tax rate to the metro area in calculating the seller’s fees. In states where the fees are negotiated or divided equally between buyer and seller, we applied half the tax rate to the seller’s portion.
Escrow fees
The national average escrow fee clocks in at around 1% and is usually split evenly between buyer and seller, according to American Family Insurance, a Fortune 500 company formed in 1927. There are exceptions, but that puts the seller portion at an estimated 0.5%, which is the rate we applied to the seller’s costs at the national and metro level in our study.
Title fees
Title fees are usually negotiable between buyer and seller in a real estate transaction. The owner and lender’s title policy together usually cost around 0.5%-1% of the purchase price, according to the American Land Title Association.
It often shakes out that the seller pays for the owner’s title policy, while the buyer covers the lender’s title policy. We estimated on average a 0.5% title fee charge where the seller cover’s the owner’s policy. In state’s where the owner’s policy costs are typically negotiated, we applied a 0.25% charge to the seller. For states where the buyer is usually responsible for covering both policies, we did not apply a title fee to the seller’s costs.
Access the full results of the study with the chart below:
| Metro Area | Median-Priced Home | Dumpster Rental | Deep Clean | Paint Interior | Replace Carpet | Basic Lawn Care | Home Staging | Agent Commissions | Transfer tax | Transfer tax (Seller Portion) | Title Fees (Owner’s Policy, Seller Portion) | Escrow Fees (Seller Portion) | Estimated Total Cost to Sell | Estimated Net proceeds |
| National Average | $324,900 | $381 | $168 | $1,886 | $1,651 | $131 | $1,261 | $18,844 | $3,736 | $3,736 | $1,625 | $1,625 | $31,308 | $293,592 |
| New York, NY | $513,000 | $487 | $171 | $2,125 | $1,306 | $240 | $1,281 | $29,754 | $2,052 | $2,052 | $0 | $2,565 | $39,981 | $473,019 |
| Los Angeles, CA | $585,000 | $365 | $160 | $2,418 | $2,082 | $225 | $3,428 | $33,930 | $644 | $644 | $1,463 | $2,925 | $47,639 | $537,361 |
| Chicago, IL | $330,000 | $347 | $138 | $1,756 | $1,305 | $144 | $505 | $19,140 | $330 | $330 | $2,925 | $1,650 | $28,240 | $301,760 |
| Dallas, TX | $303,000 | $394 | $158 | $2,009 | $2,209 | $97 | $726 | $17,574 | $0 | $0 | $1,515 | $1,515 | $26,197 | $276,803 |
| Houston, TX | $252,000 | $416 | $161 | $1,973 | $1,962 | $102 | $2,875 | $14,616 | $0 | $0 | $1,260 | $1,260 | $24,625 | $227,375 |
| Washington, DC | $599,900 | $443 | $180 | $2,044 | $1,802 | $176 | $622 | $34,794 | $8,699 | $8,699 | $1,500 | $3,000 | $53,259 | $546,641 |
| Miami, FL | $325,000 | $420 | $141 | $1,792 | $1,354 | $132 | $2,694 | $18,850 | $1,950 | $1,950 | $0 | $1,625 | $28,958 | $296,042 |
| Philadelphia, PA | $280,000 | $415 | $170 | $1,913 | $1,665 | $150 | $1,261 | $16,240 | $2,800 | $1,400 | $0 | $1,400 | $26,014 | $253,986 |
| Atlanta, GA | $350,000 | $332 | $179 | $1,870 | $1,770 | $117 | $1,015 | $20,300 | $350 | $350 | $875 | $1,750 | $28,558 | $321,442 |
| Phoenix, AZ | $318,500 | $481 | $162 | $1,887 | $2,125 | $172 | $1,261 | $18,473 | $0 | $0 | $1,593 | $1,593 | $27,746 | $290,754 |
| Boston, MA | $625,000 | $436 | $172 | $1,866 | $1,358 | $288 | $1,261 | $36,250 | $2,850 | $2,850 | $0 | $3,125 | $47,606 | $577,394 |
| San Francisco, CA | $1,390,500 | $560 | $178 | $2,601 | $2,566 | $252 | $3,420 | $80,649 | $10,429 | $10,429 | $3,476 | $6,953 | $111,084 | $1,279,417 |
| Riverside, CA | $500,000 | $413 | $177 | $1,979 | $3,060 | $176 | $3,420 | $29,000 | $550 | $550 | $1,250 | $2,500 | $42,525 | $457,475 |
| Detroit, MI | $180,000 | $330 | $162 | $1,952 | $1,775 | $84 | $1,261 | $10,440 | $1,350 | $1,350 | $900 | $900 | $19,154 | $160,846 |
| Seattle, WA | $735,000 | $465 | $182 | $2,362 | $2,127 | $322 | $1,574 | $42,630 | $9,408 | $9,408 | $3,675 | $3,675 | $66,420 | $668,580 |
| Minneapolis, MN | $155,000 | $374 | $156 | $1,492 | $1,467 | $112 | $1,325 | $8,990 | $512 | $512 | $0 | $775 | $15,203 | $139,798 |
| San Diego, CA | $650,000 | $430 | $171 | $2,123 | $1,963 | $252 | $3,420 | $37,700 | $715 | $715 | $1,625 | $3,250 | $51,649 | $598,351 |
| Tampa, FL | $248,000 | $365 | $146 | $1,646 | $1,513 | $102 | $1,996 | $14,384 | $1,736 | $1,736 | $0 | $1,240 | $23,128 | $224,872 |
| Denver, CO | $495,000 | $344 | $168 | $1,709 | $1,518 | $116 | $925 | $28,710 | $50 | $25 | $2,475 | $2,475 | $38,490 | $456,511 |
| St. Louis, MO | $155,000 | $335 | $145 | $1,597 | $1,322 | $78 | $1,261 | $8,990 | $0 | $0 | $388 | $775 | $14,891 | $140,110 |
| Baltimore, MD | $224,000 | $406 | $178 | $2,172 | $2,048 | $147 | $1,261 | $12,992 | $1,120 | $560 | $0 | $1,120 | $21,444 | $202,556 |
| Charlotte, NC | $305,000 | $410 | $153 | $1,581 | $2,440 | $105 | $1,261 | $17,690 | $610 | $610 | $0 | $1,525 | $25,775 | $279,225 |
| Orlando, FL | $312,000 | $319 | $151 | $1,472 | $1,269 | $105 | $1,996 | $18,096 | $2,184 | $2,184 | $0 | $1,560 | $27,152 | $284,848 |
| San Antonio, TX | $285,000 | $426 | $155 | $1,818 | $1,398 | $94 | $700 | $16,530 | $0 | $0 | $1,425 | $1,425 | $23,971 | $261,029 |
| Portland, OR | $435,000 | $317 | $190 | $2,013 | $2,454 | $260 | $1,261 | $25,230 | $0 | $0 | $2,175 | $2,175 | $36,075 | $398,925 |
| Sacramento, CA | $395,000 | $398 | $178 | $1,825 | $1,859 | $167 | $3,420 | $22,910 | $435 | $435 | $988 | $1,975 | $34,154 | $360,846 |
| Pittsburgh, PA | $195,000 | $356 | $149 | $1,697 | $1,495 | $117 | $1,261 | $11,310 | $1,950 | $975 | $0 | $975 | $19,310 | $175,690 |
| Las Vegas, NV | $306,000 | $316 | $168 | $1,558 | $1,807 | $195 | $1,261 | $17,748 | $1,193 | $1,193 | $1,530 | $1,530 | $27,306 | $278,694 |
| Austin, TX | $430,000 | $340 | $154 | $2,227 | $1,688 | $117 | $1,433 | $24,940 | $0 | $0 | $2,150 | $2,150 | $35,199 | $394,801 |
| Cincinnati, OH | $196,000 | $376 | $171 | $1,504 | $1,890 | $100 | $1,950 | $11,368 | $196 | $196 | $490 | $980 | $19,025 | $176,975 |
DISCLAIMER: This study provides an estimate of selling costs that are meant for educational and research purposes only; our calculation is not a guarantee.
Header Image Source: (Nathan Dumlao / Unsplash)
At HomeLight, our vision is a world where every real estate transaction is simple, certain, and satisfying. Therefore, we promote strict editorial integrity in each of our posts.