How Interlocking Oppressions Create a Massive Homeownership Wealth Gap
- Published on
- 10 min read
-
 Chelsea Levinson Contributing AuthorClose
Chelsea Levinson Contributing Author
Chelsea Levinson Contributing AuthorClose
Chelsea Levinson Contributing AuthorChelsea Levinson, JD, is an award-winning content creator and multimedia storyteller with more than a decade of experience. She has created content for some of the world’s most recognizable brands and media companies, including Bank of America, Vox, Comcast, AOL, State Farm Insurance, PBS, Delta Air Lines, Huffington Post, H&R Block and more. She has expertise in mortgage, real estate, personal finance, law and policy.
Homeownership is still considered a major hallmark of the American Dream, and it’s one of the most important ways to build wealth. Yet the opportunities of homeownership don’t play out evenly for all, which lead to wealth gaps that are driven by interlocking oppressions in real estate.
In fact, federal government data shows that home equity and retirement accounts — just two assets — make up nearly 63% of all U.S. households’ net worth.
And for people with multiple levels of marginalization — or those facing interlocking oppressions — the effects of that inequality are especially pronounced.
We’ll walk through the basics on interlocking oppressions, and the latest research on how they can play out in real estate. Here’s what Americans need to know.

What are interlocking oppressions in real estate?
Interlocking oppressions are often discussed through the framework of intersectionality. You’ve probably heard of intersectionality, as it’s a pretty hot-button issue these days. But what does it mean, exactly?
The term “intersectionality” was originally coined by Black activist and scholar Kimberlé Williams Crenshaw in 1989. Intersectionality describes how people can experience multiple, overlapping layers of marginalization simultaneously — hence the term interlocking oppressions.
For example, a Black woman experiences intersecting levels of marginalization because she is both Black and a woman. That means we can’t understand her experiences solely through the lens of being a woman, or the lens of being a Black person. We have to learn to understand how her intersecting experiences are unique because she’s both Black and a woman.
People can experience interlocking oppressions based on gender, race, sexual orientation, religion, national origin, disability, body size, sex, and more.
You might be wondering, “what does all of this interlocking oppression stuff have to do with real estate?”
Interlocking oppressions can have real-life consequences for homeowners across the U.S. Let’s look at some numbers that indicate how this theory plays out when it comes to how much we earn, where we live, and the wealth we accrue as a result.
Income levels by race and gender
One big way we can see interlocking oppressions play out is through disparate levels of earnings.
For example, it’s a commonly cited statistic that women earn roughly 79 cents on the dollar compared with men (though more recent studies find that gap to be more like 82 cents on the dollar). But for Black women, median earnings are actually much lower.
Here are median income levels by race and gender:
- All men: $52,146
- White men: $60,388
- Black men: $42,076
- Hispanic men: $38,876
- Asian men: $67,673
- All women: $41,977
- White women: $46,513
- Black women: $36,735
- Hispanic women: $32,002
- Asian women: $51,378
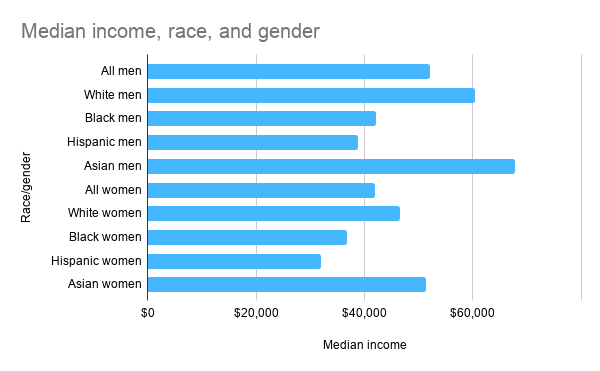
Source: U.S. Department of Labor
These income levels show that Black women make closer to 70 cents on the dollar compared with men overall, and just 61 cents on the dollar compared with white men. Meanwhile, compared with Black men, Black women make 87 cents on the dollar.
With these numbers, we can start to see the different dynamics of interlocking oppressions play out: Black people overall earn less than white people. Women overall earn less than men. Black women face multiple levels of income disadvantage, and thus earn significantly lower wages because of it.
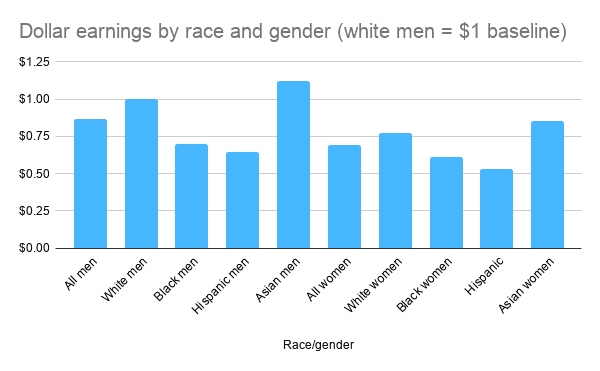
Source: U.S. Department of Labor
The impacts of disparate income levels
Disparate income levels can have huge consequences for people who face multiple levels of marginalization, affecting their ability to build wealth over time.
“Over a 40-year career, Black women typically lose $941,600, Native American women typically lose $1,035,360, and Latinas typically lose $1,121,440 million in comparison to white, non-Hispanic men,” found a recent study by the National Women’s Law Center.
They further explain: “Assuming a 40-year career, Black women would have to work nearly 25 years longer than white, non-Hispanic men in order to close the lifetime wage gap. Native American women would have to work 30 years longer, and Latinas would have to work 33 years longer.”

Homeownership rates
Homeownership rates can also tell us a lot about who gets access to the American Dream, and who gets left behind.
Homeownership rate by race
According to the latest government homeownership data, homeownership rates vary significantly across races in the U.S.
- All U.S. homeownership rate: 67.9%
- White homeownership rate: 76%
- Black homeownership rate: 47%
- Hispanic homeownership rate: 51.4%
- Asian, Native, Hawaiian, and Pacific Islander homeownership rate: 61.4%
So, white people have much higher homeownership rates than nonwhite people. And with homeownership constantly touted as one of the top ways to build wealth in the U.S., this puts nonwhite people — who are already paid lower wages — at yet another disadvantage.
Keep in mind the racial homeownership gap is complex, and homeownership rates alone can’t tell us everything.
For example, research shows that Black people buy cheaper first homes (and take on more debt doing it), buy homes later in life, and are less likely to sustain homeownership over time.
Ultimately, these factors — along with widespread structural inequality across the real estate industry — make it a lot more challenging for Black people to build wealth through homeownership.
Homeownership by gender
Government homeownership data by gender isn’t easy to come by, but a recent study by Lending Tree found that single women are outpacing single men in homeownership rates, with single women owning 22% of homes, while single men own fewer than 13% of homes.
Again, it’s important to keep in mind that homeownership rates aren’t everything. While women may be making strides when it comes to buying homes, it turns out that there’s still a gender wealth gap when it comes to actually owning homes (more on that in a bit).

Home values and appreciation rates
Income levels and homeownership rates can illustrate a lot about interlocking oppressions, but it’s also important to look at how homes hold value and appreciate over time.
Think of it this way: if you own a home and it majorly drops in value — as many homes did during the Great Recession — that’s going to affect your entire financial picture. Your home is likely your biggest investment. For it to be a good investment, it should appreciate in value over time, making you wealthier as the years pass.
But what if your home was worth less because of your race or gender? That’s the reality for millions of Americans.
This is another area where levels of marginalization come into play, and outcomes vary drastically from one group of homeowners to the next.
Black home values are consistently lower
In the U.S., Black-owned homes are worth far less than white-owned homes, and they appreciate less, if they appreciate at all.
A study by the Brookings Institute found that Black neighborhoods — or those where the population is more than 50% Black — are valued at around half the price of homes in white neighborhoods with no Black residents.
So just how many Black people are affected by this devaluing of Black property? Currently, 37% of Black people in the U.S. live in neighborhoods with a Black majority, so this has massive effects on Black wealth.
The study also found that “Homes of similar quality in neighborhoods with similar amenities are worth 23% less ($48,000 per home on average, amounting to $156 billion in cumulative losses) in majority Black neighborhoods, compared to those with very few or no Black residents.”
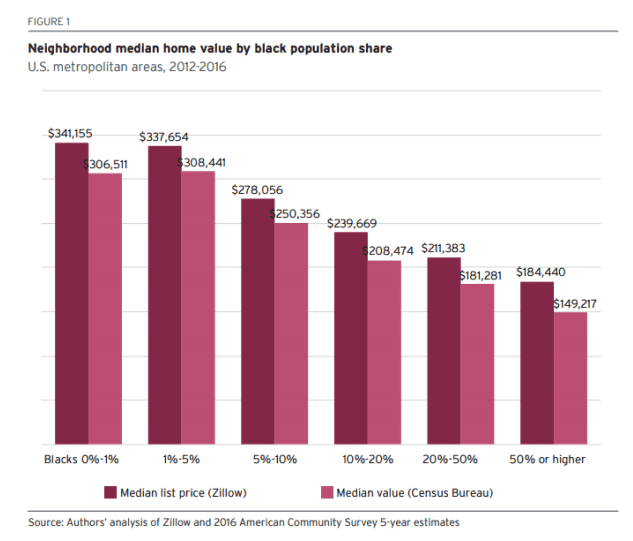
Source: The Brookings Institute Know Your Price: The Devaluation of Residential Property in Black Neighborhoods.
This home value disparity is also found to limit upward mobility for Black children who grow up in these communities, creating generational barriers to wealth.
Home appreciation is not equal across races
Home appreciation is another important factor to look at because it helps show how much wealth a homeowner can build as their investment grows.
A study by the American Center for Progress found that even as home prices have appreciated nationally since the Great Recession, racial disparities in home appreciation persist.
According to their findings, homes in Black neighborhoods have depreciated 6% since 2006, while home prices in white neighborhoods increased in value by 3%. The home appreciation disparity is apparent, even when controlling for the homeowner’s income levels.
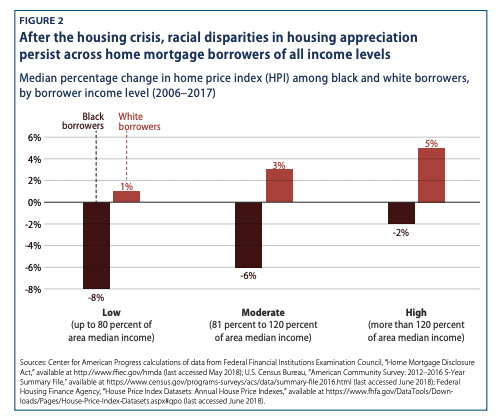
And because Black people tend to buy homes in predominantly nonwhite neighborhoods, these low home appreciation rates disproportionately harm Black homeowners as a whole.
Home value and appreciation by gender
Remember how single women are buying more homes than single men? Unfortunately, they’re not seeing the same return on investment.
A recent study by Yale found that “single women see significantly lower returns from buying and selling real estate than single men, losing out on an average of $1,600 per year.”
The study revealed that single women pay around 2% more for homes than single men, and when they sell, they get 2% less. That means single women get around 1.5% less in annual returns on their home purchase. And although these may sound like small numbers, they can really add up over a lifetime — especially when compounded with lower pay.
“Housing represents the largest category of household saving,” Kelly Shue, professor of finance and one of the co-authors of the study, explains. “It accounts for a greater fraction of total retirement savings than stock investment. Therefore, to lose any percentage on housing really impacts the gender gap in wealth accumulation.”
This gender wealth accumulation gap is no doubt felt deeply by women of color, especially Black women.
For example, one way lower home values play out is through discrimination in home appraisals.
According to The New York Times, Abena Horton, a Black woman, welcomed an appraiser to set a value for the home she and her husband Alex were selling.
The home was expected to appraise at $450,000, yet the appraisal came back substantially lower, at just $330,000. Horton immediately suspected discrimination, and she ordered a second appraisal. This time, though, she asked her white husband to greet the appraiser, and Horton left to run errands with the couple’s young son.
Before the second appraisal, the couple removed all evidence that Black people lived in the home. The second appraisal came in at $465,000 — an increase of more than 40% over the first.
This is one of the many insidious ways homes are devalued for marginalized groups of people.

Home equity rates
Owning a home is one thing, but building equity in it is quite another. Equity is how much value you actually own in the home. More specifically, home equity is calculated as the property’s current market value, excluding the outstanding balance of all loans on the property.
So if your home is worth $200,000, and you owe $150,000 to your mortgage lender, you have $50,000 of equity in your home.
Home equity is a big way Americans build wealth over time. But as with the other data we’ve looked at, equity plays out differently for different groups of people.
The racial home equity gap
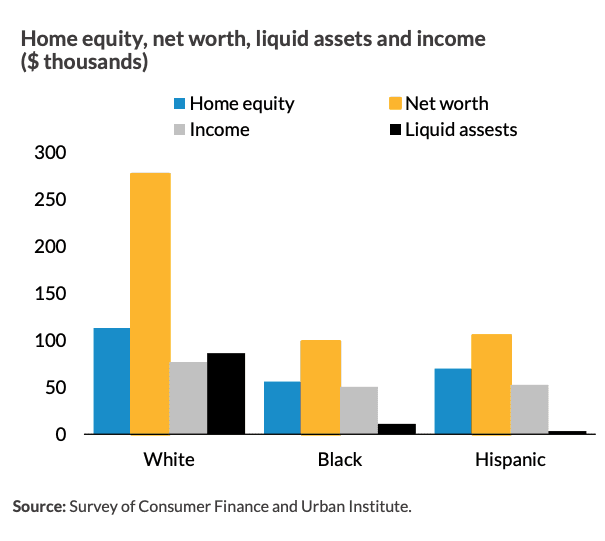
Here are home equity values by race:
- All homeowners: $118,000
- White homeowners: $120,000
- Black homeowners: $72,990
- Asian homeowners: $200,000
- Hispanic homeowners: $88,000
We can see that Black and Hispanic homeowners have substantially less equity in their properties than white and Asian homeowners.
And this Urban Institute data shows us that not only is there a racial home equity gap, but there’s also a massive wealth gap, too:
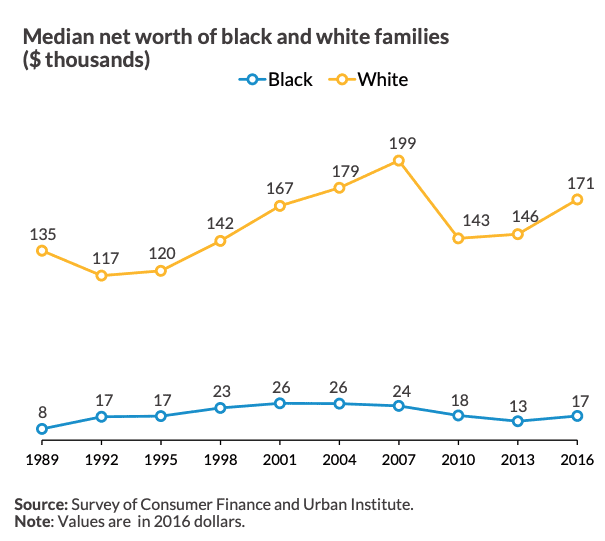
Source: Urban Institute BLACK HOMEOWNERSHIP GAP: RESEARCH TRENDS AND WHY THE GROWING GAP MATTERS
Further compounding matters, Black homeowners rely heavily on their properties to build wealth.
“For black homeowners, home equity represents a greater part of their net worth than it does for white homeowners,” explains a recent report by the American Center for Progress.
They go on: “Center for American Progress analysis of Federal Reserve data indicates that primary residences account for 58% of African Americans’ net worth, compared with 40% of whites’ wealth portfolio, which is more diversified than that of nonwhite households. Yet, in 2016, the mean net housing wealth of white homeowners was $215,800, compared with only $94,400 among black homeowners.”
The gender home equity gap
Again, it’s more difficult to come by government home equity data by gender, but some recent data released by Redfin can give us some context. Their research found that single women earn around 92 cents in equity for every dollar of equity that single men earn.
Redfin analyzed nearly 80,000 homes bought by single women in 18 of the largest cities in the U.S.
“On those home purchases, women earned a median $171,313 of home equity over five years compared to $186,403 of equity earned by men — a difference of $15,090 or 8.1%,” they explained.
The gender equity gap was more pronounced in some cities than others. And in New Orleans, single women managed to gain more equity than single women. But in most major U.S. cities, single women lag in equity behind single men.

Combatting interlocking oppressions in real estate
Interlocking oppressions are a big problem that extend well beyond the real estate industry, as we’ve seen. So what can you do today to help?
- Do you have employees? Employers must pay employees fairly regardless of race, gender, disability level, and other demographic descriptors. Review your pay policies to ensure parity across employees.
- Are you a homeowner? Familiarize yourself with how tax assessments and appraisals work in the real estate industry. Keep tabs on your home’s value, and understand your options for challenging an official value of your property’s worth.
- Advocate for representation. We didn’t include numbers around LGBT homeownership because that’s not a demographic identifier that the government tracks via the U.S. Census, and unfortunately, there is not a lot of independent research available. (One survey indicates that 49% of LGBT households are likely to own their home.) The more we learn about how different groups are discriminated against, the more we can do to rectify the situation today. Pay attention to proposed changes to the U.S. Census, and call your representatives to ask them to advocate for representation.
To learn more about issues surrounding racism and real estate, visit our resource library.
Understanding how interlocking oppressions have made homeownership and wealth-building harder for some Americans than for others is an important first step toward a more just and equitable society.
By keeping yourself educated and up-to-speed on these topics, whether or not you feel personally affected by them, you’re helping to establish a foundation of familiarity with social justice issues that will (hopefully) lead us to better, more productive conversations and actions moving forward.
Header Image Source: (Curtis Adams / Pexels)
At HomeLight, our vision is a world where every real estate transaction is simple, certain, and satisfying. Therefore, we promote strict editorial integrity in each of our posts.