
U.S. Real Estate Market Overview: National Housing Trends and Insights
- Published on
-
 Caroline Feeney Former Executive EditorClose
Caroline Feeney Former Executive Editor
Caroline Feeney Former Executive EditorClose
Caroline Feeney Former Executive EditorCaroline Feeney was previously HomeLight's Executive Editor / Director of Content. With 7 years of real estate reporting and editing experience, she previously managed content for Inman News and co-authored a book on real estate leadership. The Midwest native holds a master's from the Missouri School of Journalism and was formerly a real estate contributor for Forbes.
Sunday afternoon open houses, a surge in buyer traffic, for-sale signs taking over front lawns — these were meant to be the hallmarks of a busy 2020 spring real estate season. Instead, the market hit a wall when the coronavirus unleashed a public health crisis of unprecedented proportions and challenged the traditional ways of buying and selling homes like never before.
While the pandemic knocked the wind out of many people’s plans to list or buy, the resume button is in reach as signs of hope and resilience emerge in the spirit of settling into a new normal. Let’s take a look at how some key market indicators offer clues into the next chapter of U.S. real estate at the national level.

Drop in new home sales reflects early buyer fears
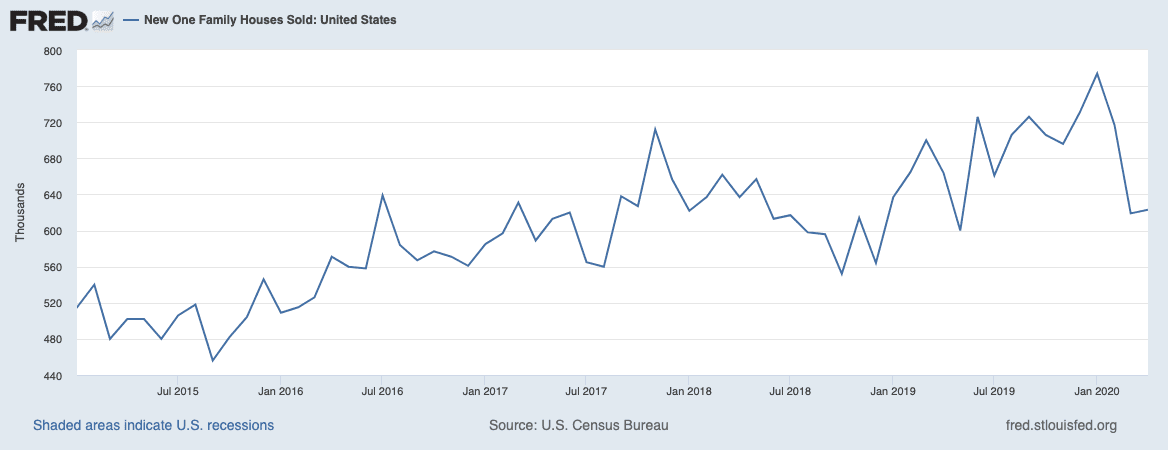
In March, sales of newly constructed single-family homes tumbled 14% month over month to an annual sales rate of 619,000 homes, according to data from the Census Bureau.
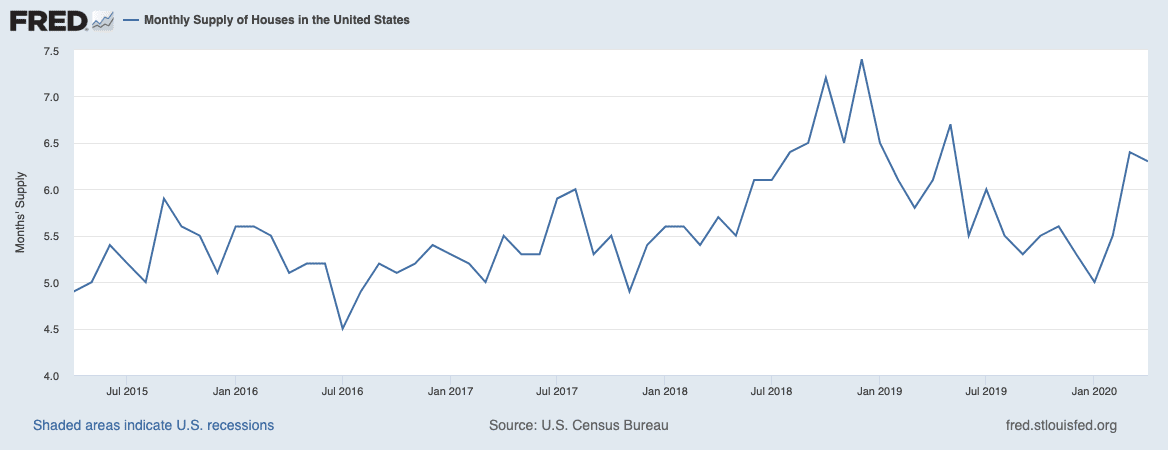
The slower pace of sales caused an uptick in the supply of new homes, from 327,000 homes in February, to 331,000 in March. This put new homes at a 6.4 months level of supply (a measurement of how long it would take to sell all of the new homes on the market, if no new homes were built) up from 5.5 months in February.
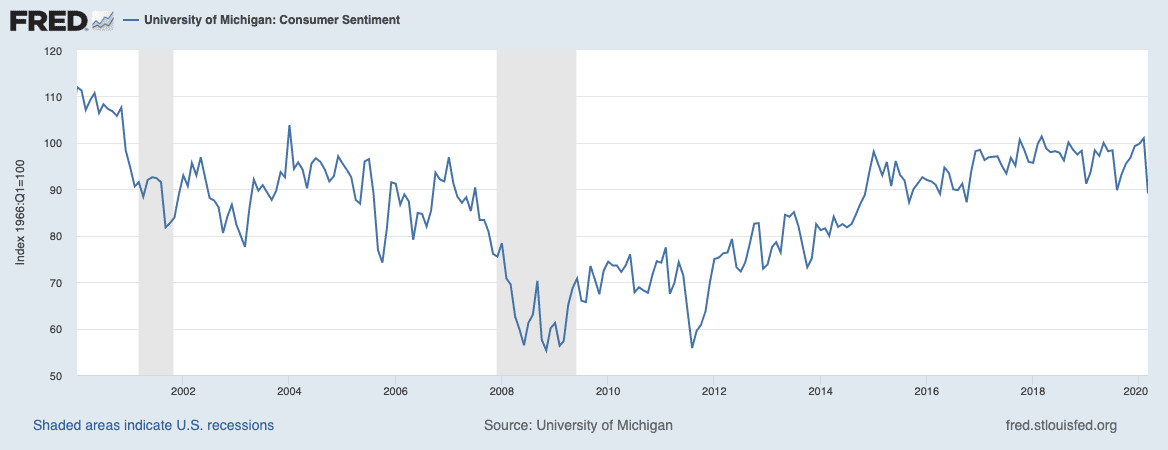
Because new home sales measure contract signings, rather than closings, this data from the Census Bureau was one of the first real-time signals of demand headwinds caused by the pandemic. During the same period, consumer sentiment dropped 11.8%, data from the University of Michigan shows — and consumer sentiment is closely tied to big purchase decisions like buying a home.
However, some positive signs of stabilization emerged just a month later: In April, new home sales essentially flattened (rising 0.6%) — which was a surprising comeback considering the previous month’s performance. As a result, new home sales supply remained fairly level, even declining slightly to 6.3 months.
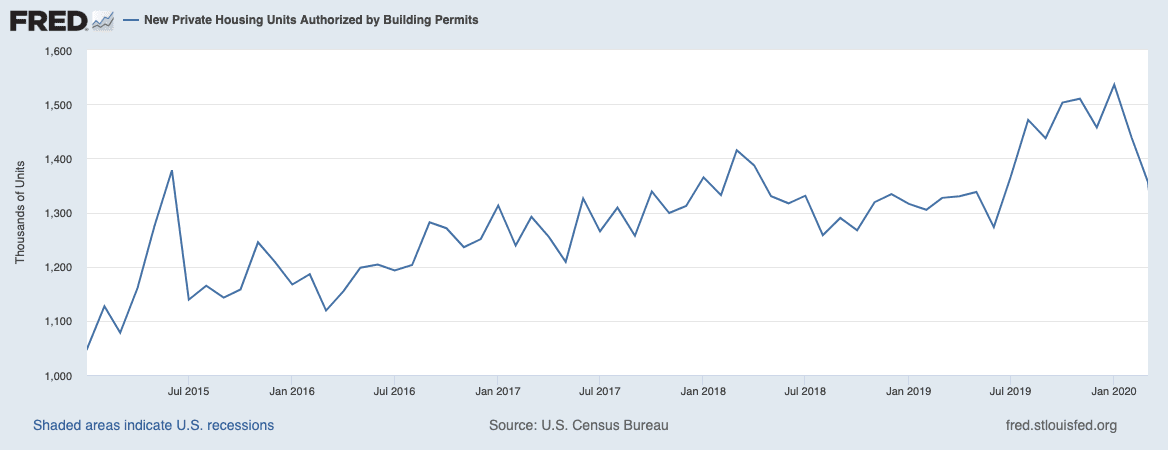
Builders can’t build without definite demand
Prior to the coronavirus, many builders had started to gain momentum after struggling for years to meet insatiable buyer demand. In December 2019, housing starts jumped nearly 16% month over month and fueled hopes for robust construction moving forward.
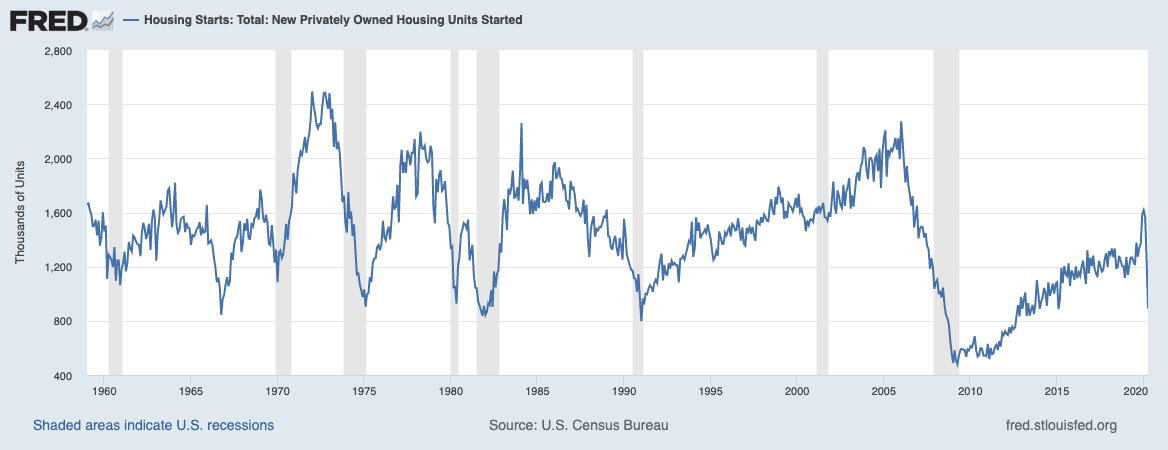
However, until builders are more confident that buyer activity will pick up, permits and starts are likely to stall. In April, authorized building permits dropped 21%, while housing starts continued their downward cascade, falling 30% from March to April.
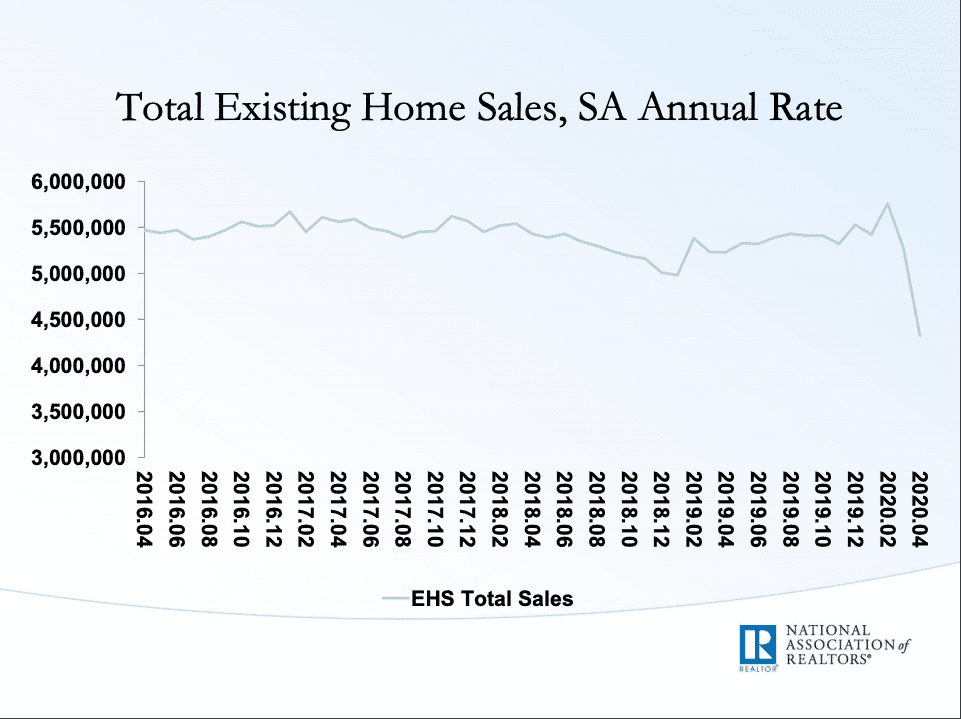
Existing homes supply stays in ‘seller’s market’ territory
Keep in mind that new construction only accounts for about 10% of all housing market sales. Existing home sales, measured by the National Association of Realtors (NAR), are a lagging indicator as a measure of closings and account for the remaining 90%.
In April, existing home sales plunged 17.8%, no doubt a reflection of the stay-at-home or shelter-in-place directives that froze Americans in place across much of the country.
That’s a shocking figure, but it doesn’t do much to shake the foundation of the market. Here’s why: Unsold inventory for existing single-family homes, condos, and co-ops ticked up from a 3.4 month supply in March to 4.1-month supply in April. Despite the modest supply increase, inventory remains well within seller’s market conditions (characterized by less than six months of supply), serving as a protective barrier for home prices.
If you think about it, while supply for new homes is driven by factors like builder confidence and available labor, existing homes free up when someone is driven to move. So even as buyer activity slowed this spring, so too did people hold off on listing their homes, which prevented the scales from tipping too far toward a buyer’s market. Considering some markets saw drops in new listings upward of 80% as sellers thought twice about moving, a lack of supply especially for existing homes appears to be keeping the market tight.
Mortgage rates remain low and stable
With the Federal Reserve indicating it plans to keep the benchmark interest rate near zero for as long as is necessary, mortgage rates are staying at very low levels with the 30-year fixed averaging 3.24% as of May 26, according to data from Freddie Mac. Note that mortgage rates don’t move in lockstep with Fed policy, and are influenced by other factors like a lender’s overall risk.
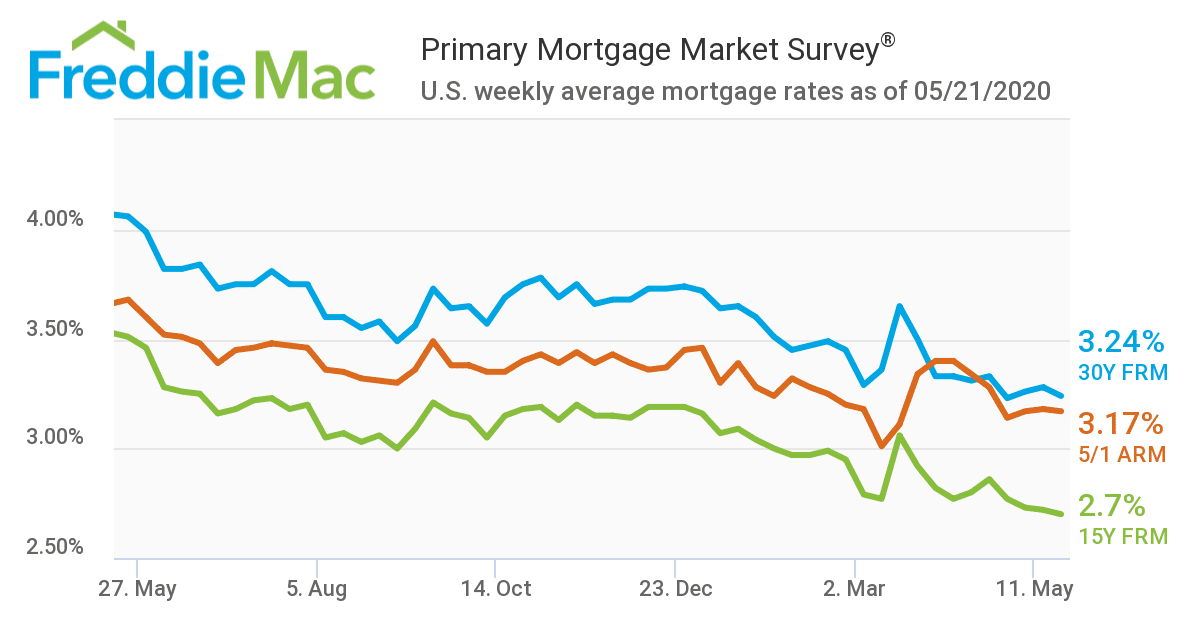
But from a broad view, low mortgage rates are one incentive for buyers on solid financial footing to continue their search, and may help to keep stoking the coals of the market in this challenging environment. As NAR Chief Economist Lawrence Yun commented in April’s existing home sales report: “Record-low mortgage rates are likely to remain in place for the rest of the year, and will be the key factor driving housing demand as state economies steadily reopen.”
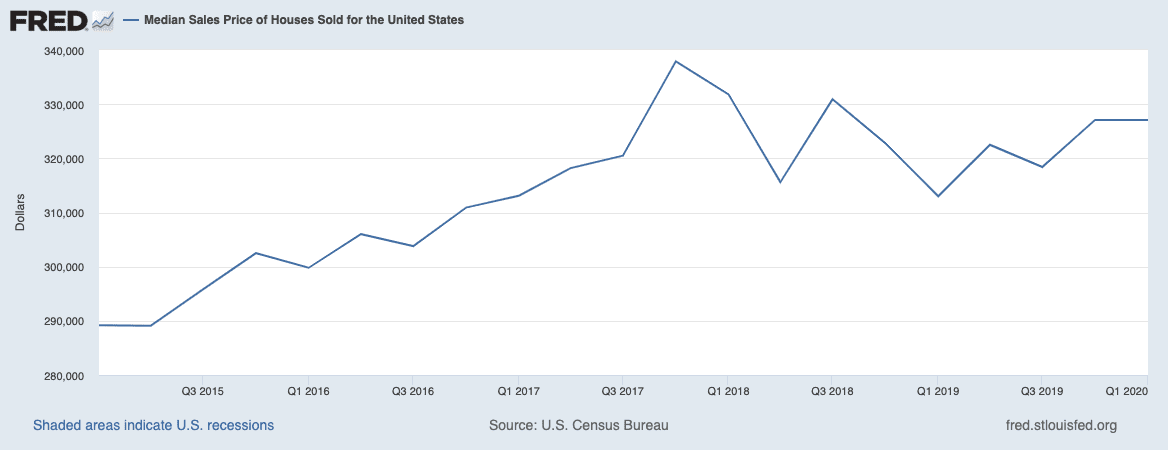
Price growth may slow, but so far nothing drastic
The median sales price of houses sold in the U.S. flatlined from Q4 2019 to Q1 2020 at $327,100, according to data from the U.S. Census Bureau and U.S. Department of Housing and Urban Development. However, the median sales price is still up 4.5% YoY
New home prices suffered a bit, declining 8.5% between March and April — to a median price of $309,900. However, analysts attribute this mostly to the mix of homes sold, with homes in lower price ranges selling more than those in the luxury tier.
These numbers highlight a couple of things. First: the strength of the housing market before the crisis, when steady price growth was long the norm. It also reflects the inventory surge of early 2019 that caused a bit of a market softening, hence the strong YoY gains and why the quarterly losses aren’t yet cause for huge concern. (To put it in perspective, at the peak of the subprime mortgage crisis, prices dropped 18% YoY).
Analysts expect that price growth may slow this year, or that we may even see a decline in values. But it’s too soon to tell exactly how that will play out, or how much prices will correct amidst a challenging recession.
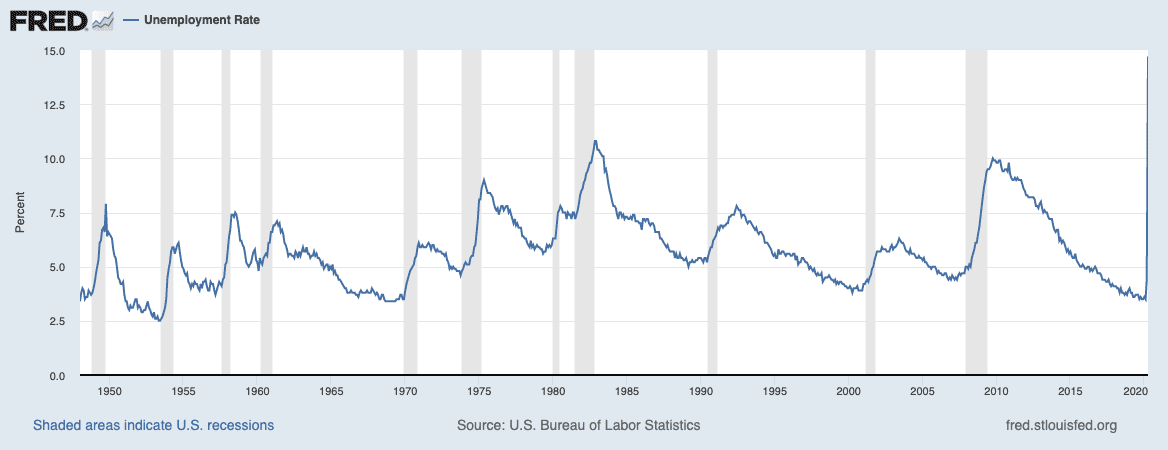
Severe job loss adds immense pressure
The most alarming data point to track in the wake of the pandemic is unemployment. According to data from the U.S. Bureau of Labor Statistics, between March and April, unemployment increased 10.3 percentage points, from 4.4% to 14.7%, with the loss of 20.5 million additional nonfarm payroll jobs. It’s possible that the jobless rate could reach upward of 25%.
Depending on how long huge swaths of people are out of work, and how many of those jobs come back, the housing market could face additional and significant pressures. The loss of income could dampen buyer demand and cause increased financial distress for homeowners.
What’s in store for housing?
With housing coming into the crisis with so little supply and substantial demand, the chances of a total market collapse seem slim despite the inevitable slowdown playing out now. Meanwhile, given some time to work out the precautions for selling and buying homes safely (with masks, gloves, and social distancing measures becoming second nature) it’s worth keeping an eye on a potential market rebound as we wrap spring and head into summer.
Header Image Source: (Benjamin Elliott / Unsplash)
At HomeLight, our vision is a world where every real estate transaction is simple, certain, and satisfying. Therefore, we promote strict editorial integrity in each of our posts.