
Agent Metrics That Matter: How to Read Days on Market, Sale-to-List, and CMAs
- Published on
- 8 min read
-
 Richard Haddad Executive EditorClose
Richard Haddad Executive Editor
Richard Haddad Executive EditorClose
Richard Haddad Executive EditorRichard Haddad is the executive editor of HomeLight.com. He works with an experienced content team that oversees the company’s blog featuring in-depth articles about the home buying and selling process, homeownership news, home care and design tips, and related real estate trends. Previously, he served as an editor and content producer for World Company, Gannett, and Western News & Info, where he also served as news director and director of internet operations.
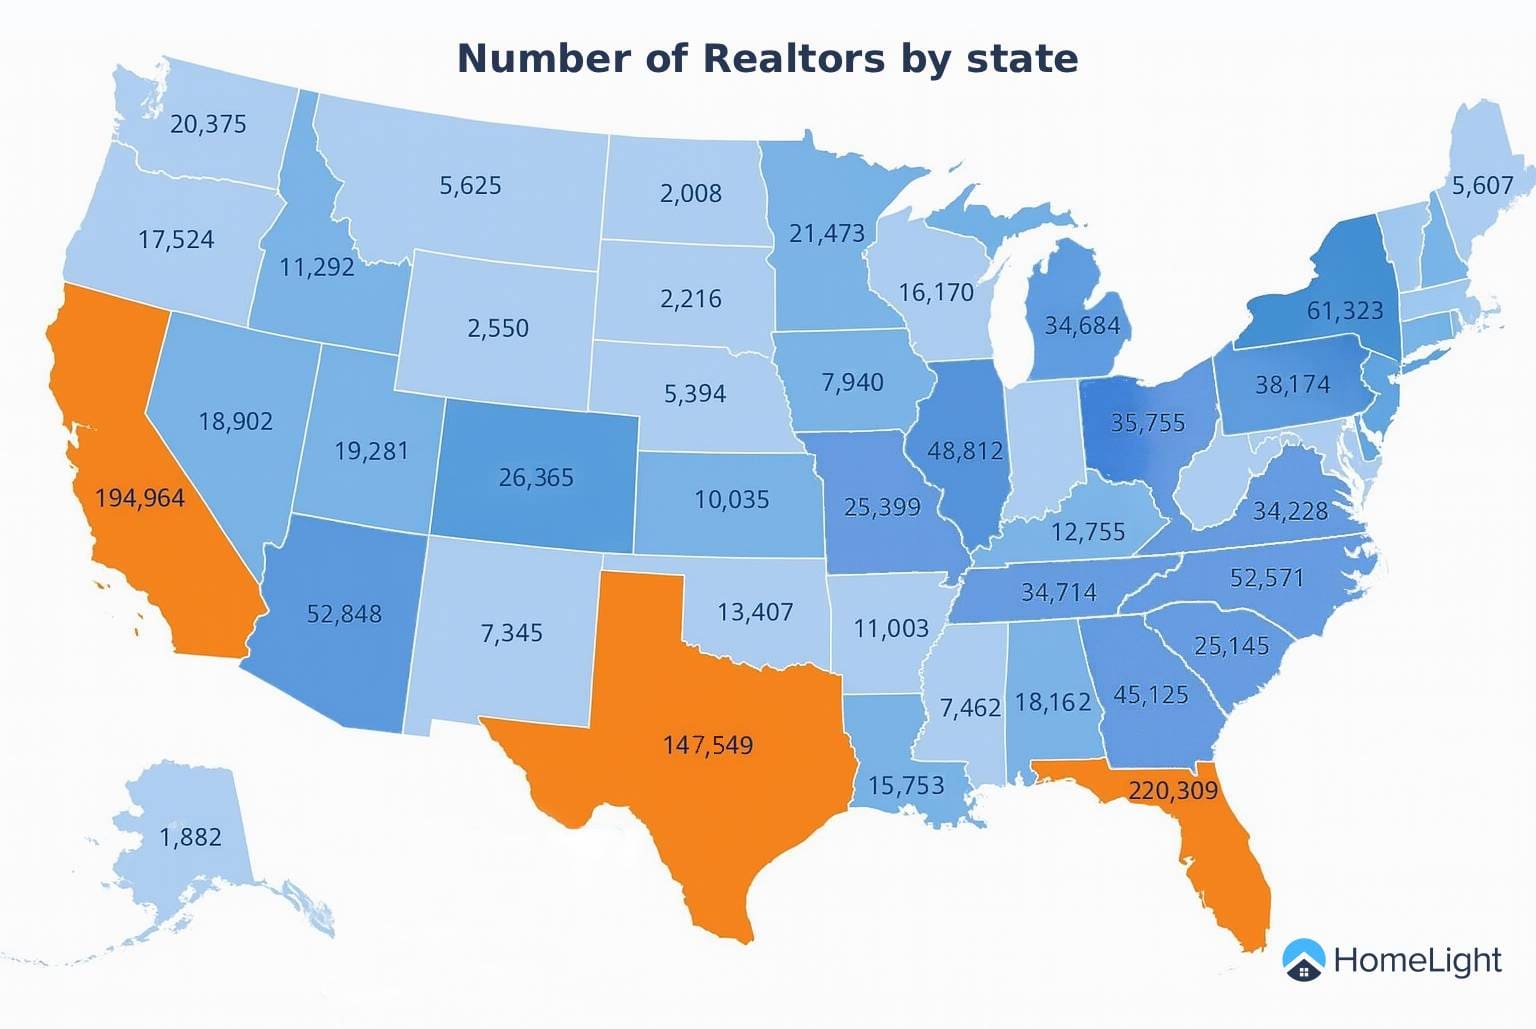
It’s estimated that nearly 3 million people hold an active real estate license in the United States. Nearly half (1.45 million) are also members of the National Association of Realtors (NAR). If you’re making plans to sell your house, there are some key real estate agent performance metrics you should scrutinize before you sign a listing agreement.
By learning to interpret data points like Days on Market (DOM), the sale-to-list price ratio, and the Comparative Market Analysis (CMA), you can select an agent who is statistically proven to sell homes faster and for more money.
At HomeLight, we analyze millions of transactions to identify agents who consistently outperform their peers on these very metrics. Let’s start with how long it takes an agent to sell a house.
Connect with a Trusted, Top-Rated Local Agent
We’ve analyzed real estate transaction data and customer reviews to identify agents who go above and beyond, selling their clients’ homes faster and for more money. Great agents have seen it all — and know how to avoid common seller mistakes.
What is Days on Market (DOM), and why is it important?
Days on Market (DOM) is the number of days a home is actively listed for sale on the Multiple Listing Service (MLS) before the seller accepts an offer and the home goes into contract. A low average DOM is a clear indicator of an agent’s effectiveness, as it reflects their ability to price, market, and sell a home efficiently.
The importance of DOM cannot be overstated. A home that sells quickly is less likely to become “stale.” This can lead to price reductions and lower offers. An agent with a consistently low DOM is skilled at creating urgency and attracting serious buyers from the start, usually leading to higher proceeds for you.
How to interpret an agent’s average DOM
An agent’s average DOM is a telltale piece of their performance puzzle, but it needs context. A 30-day DOM might be exceptional in a market where the average home sells in 60 days, but it would be average in a market where homes typically sell in 30 days.
When you’re evaluating an agent, always compare their average DOM to the local market average for similar homes. A top-performing agent will consistently have a DOM that is significantly lower than their market’s average. In most cases, this means their pricing and marketing strategies are superior to their competitors’.
HomeLight’s free agent-matching platform does this analysis for you. We provide transparent performance data, showing you how an agent’s average DOM stacks up against others in your specific neighborhood, so you can easily spot the true standouts.
The hidden costs of a high DOM
When a home lingers on the market, it costs you more than just time. The longer your property is listed, the more you pay in carrying costs, including mortgage payments, property taxes, insurance, and utilities. Beyond the financial strain, there’s an emotional toll of keeping your home in show-ready condition, accommodating last-minute showings, and living in a state of uncertainty.
Furthermore, a high DOM can create a negative perception among buyers. They may assume something is wrong with the house or that it’s overpriced, leading them to either skip your listing or submit a lowball offer. A top agent will avoid this from the start, protecting your equity and your peace of mind.
Understanding the sale-to-list price ratio
The sale-to-list price ratio is a percentage calculated by dividing a home’s final sale price by its last list price. This metric reveals how close to the asking price an agent typically sells their listings for. A ratio at or above 100% indicates the agent sold the home for the list price or higher, which is a strong sign of accurate pricing and skilled negotiation.
Formula: (Final sale price / Final list price) x 100 = Sale-to-list price ratio
For example, if a home was listed for $400,000 and sold for $405,000, the sale-to-list ratio would be 101.25%. If it sold for $390,000, the ratio would be 97.5%.
What does a high sale-to-list ratio tell you about an agent?
An agent’s average sale-to-list ratio is a direct reflection of their pricing strategy and negotiation skills.
- Above 100%: A ratio consistently near or above 100% suggests the agent is an expert at pricing homes accurately. They understand the market so well that their listings attract competitive offers that meet or exceed the asking price.
- Below 100%: A ratio significantly below 100% can be a red flag. It may indicate a pattern of overpricing homes to win listings, only to recommend price cuts later when the property fails to sell.
How to analyze an agent’s sale-to-list performance
When reviewing an agent’s sale-to-list ratio, look for consistency across their recent sales. A single great sale doesn’t prove expertise, but a pattern of selling homes at or above list price does.
As with DOM, context is crucial. An agent who achieves a 99% ratio in a market where the average is 96% is a far stronger performer than an agent who hits 100% in a market averaging 101%. HomeLight analyzes these nuances across millions of transactions, ensuring the agents we recommend have a proven history of delivering on price for their clients.
How Much Is Your Home Worth Now?
Home values have rapidly increased in recent years. How much is your current home worth now? Get a ballpark estimate from HomeLight’s free Home Value Estimator.
How to read a CMA (Comparative Market Analysis)
A Comparative Market Analysis, or CMA, is a detailed report that real estate agents create to determine a home’s current market value. To read a CMA effectively, you should focus on the quality of the “comps” (comparable properties), the adjustments made for differences, and the logic behind the final suggested price range. This document is the foundation of your agent’s pricing strategy.
A well-prepared CMA is not just a collection of data; it’s an agent’s business plan for selling your home. It should give you a clear, evidence-based understanding of where your property fits into the current market.
What are the key components of a good CMA?
When an agent presents you with a CMA, look for these three key components:
1. Comparable Properties (“Comps”): These are the heart of the CMA. A good comp is a home that is very similar to yours in terms of location, size, age, condition, and features. The most relevant comps are those that have sold within the last three to six months.
2. Adjustments: No two homes are identical, so agents make value adjustments to account for differences. For example, if your home has a newly remodeled kitchen but a comparable home does not, the agent will adjust the comp’s sale price upward.
3. Suggested Price Range and Strategy: A professional CMA concludes with a recommended price range. The agent should be able to present a pricing strategy based on this range. For instance, pricing at the lower end to ignite a bidding war or pricing at the higher end if your home has unique or desirable features.
Red flags to watch for when reviewing a CMA
The CMA is also where you can spot an agent who might not be the right fit. Watch out for these warning signs:
- “Buying the listing”: Be cautious of an agent who suggests a listing price that is dramatically higher than what other agents recommend, especially if they can’t provide solid data to support it. This tactic, known as “buying the listing,” is used to win your business with an inflated promise, often leading to frustrating price reductions down the road.
- Poorly chosen comps: If the comps are from a different neighborhood, are much larger or smaller than your home, or sold over a year ago, the CMA’s conclusion is likely inaccurate.
- Lack of detail or explanation: A trustworthy agent will gladly walk you through their comparative market analysis and explain their reasoning. If an agent is vague or dismissive of your questions, it may signal a lack of thoroughness.
What are homes selling for in your city? Active or pending listings can provide insight into the current competition, but sold listings are the most reliable indicator of true market value. See the selling prices in your neighborhood using HomeLight’s Recently Sold Homes map. (As you zoom in on your city, allow the map time to load.)
Putting it all together: Using metrics to choose the right agent
Use Days on Market, sale-to-list price ratio, and the CMA together to form a comprehensive view of an agent’s ability to deliver genuine results. A top-rated agent will demonstrate excellence across all three areas:
- A history of fast sales (low DOM)
- A record of achieving high prices (high sale-to-list ratio)
- A clear, data-backed strategy (a professional CMA)
These real estate agent performance metrics are deeply interconnected. An accurate and compelling CMA is the strategic foundation that enables an agent to achieve a high sale-to-list ratio and a low DOM. Together, these metrics are the best predictor of future success with your home sale.
How HomeLight simplifies the selection process
Instead of asking every potential agent for their stats and trying to compare them yourself, you can use HomeLight to do the heavy lifting. We simplify the entire process by analyzing agent performance on your behalf.
Our data-driven platform matches you with top-performing agents in your area who have a proven track record of selling homes like yours faster and for more money.
We believe in transparency and results, which is why our service is free to home sellers and agents can’t pay to be featured. Tell us a little about your selling plans and timeline, and we’ll connect you with the best agent for the job based on their actual performance data.
Don’t leave one of your biggest financial transactions to chance. Make a smart, data-informed decision.
You’ll find more helpful tips and guides in HomeLight’s Seller Resource Center.
Header Image Source: (Venrick Azcueta/ Unsplash)
At HomeLight, our vision is a world where every real estate transaction is simple, certain, and satisfying. Therefore, we promote strict editorial integrity in each of our posts.