
What Is a Comparative Market Analysis? Your Page-By-Page Breakdown
- Published on
- 9 min read
-
 Melissa Rudy Contributing AuthorClose
Melissa Rudy Contributing Author
Melissa Rudy Contributing AuthorClose
Melissa Rudy Contributing AuthorMelissa Rudy is a seasoned digital journalist with 15 years of experience writing web copy, blog posts and articles for a broad range of companies. When she can’t buy or sell homes, she settles for the next-best thing: researching and writing about all things real estate-related.
A comparative market analysis (known as a CMA for short) is one of the best available ways to find out what your home is worth in today’s market. So what is a comparative market analysis, and how can you use one to determine how much your property could sell for?
Considering a thorough CMA often contains 30-40 pages of data and charts, it can be hard to digest all of the information if you don’t know what to look for. To get clarity, we spoke to a top real estate agent in the East Bay of San Francisco who’s created countless CMAs over 18 years. Our guide breaks down each component of the common real estate pricing tool page by page with visuals.
Comparative market analysis: A brief definition
Rick Fuller, our top-performing Bay Area real estate agent, identifies a CMA as the single most important tool in assessing the market value of a property. A CMA usually comes in the form of a small booklet real estate agents prepare on behalf of their seller clients to set an appropriate list price.
The primary purpose of a CMA is to compare a subject property against “comps” or nearby homes that have recently sold or gone under contract. These comps provide a reference point for how much a real buyer would pay for a home that’s about to go on the market. You can expect a CMA to feature a combination of property details pulled from the MLS, interior and exterior listing photos, and market indicators like inventory levels for the surrounding area.
Let’s review each part:
Property details
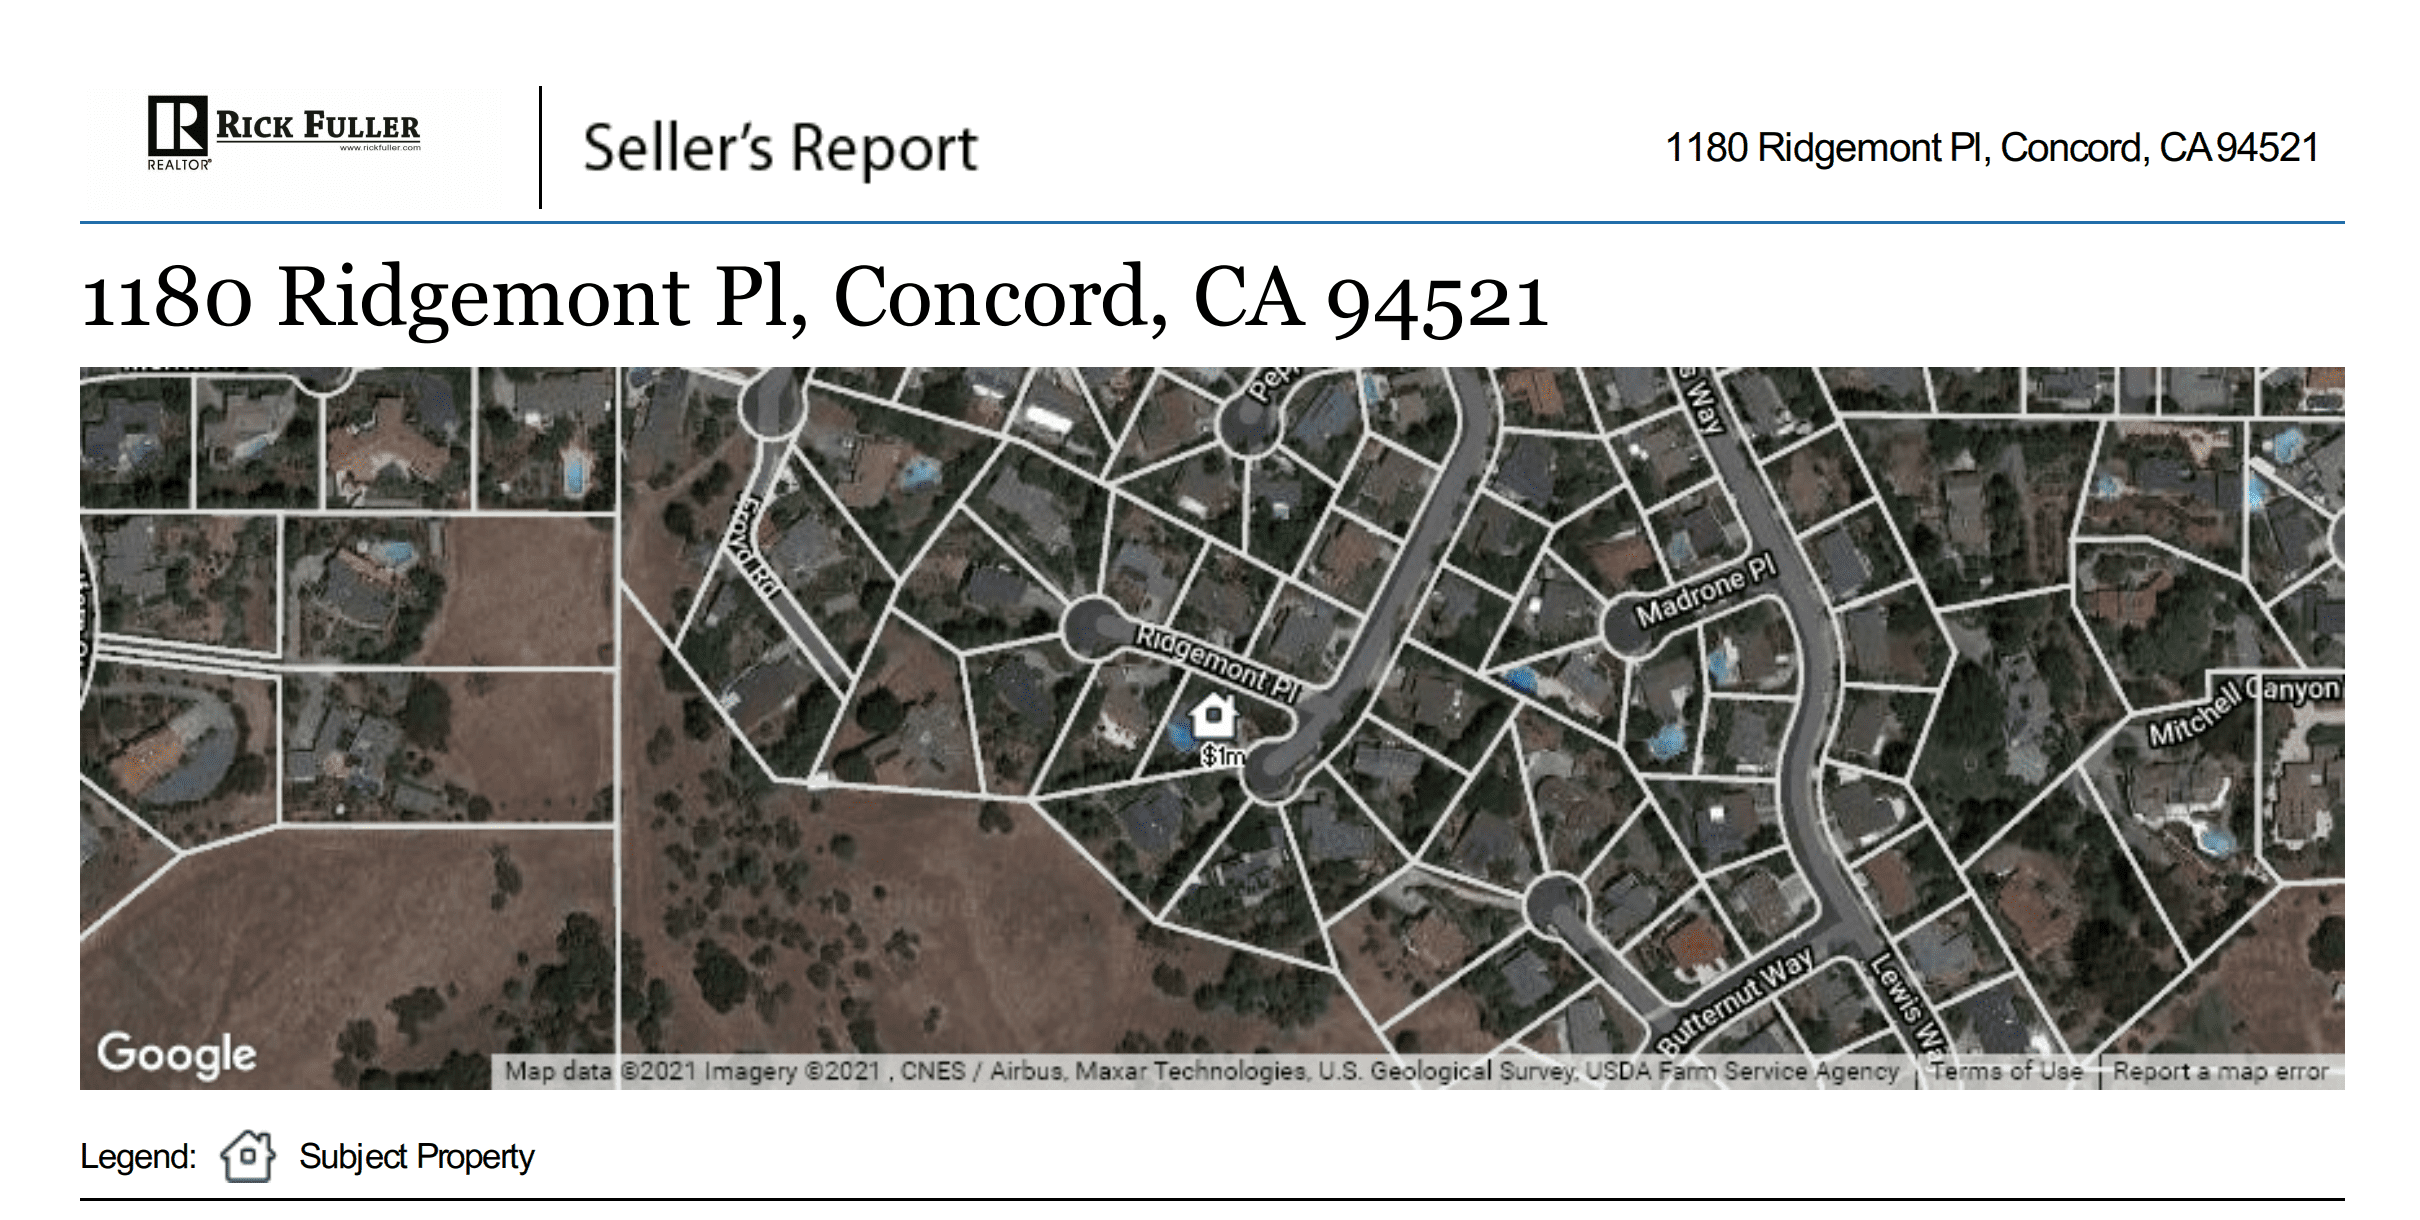
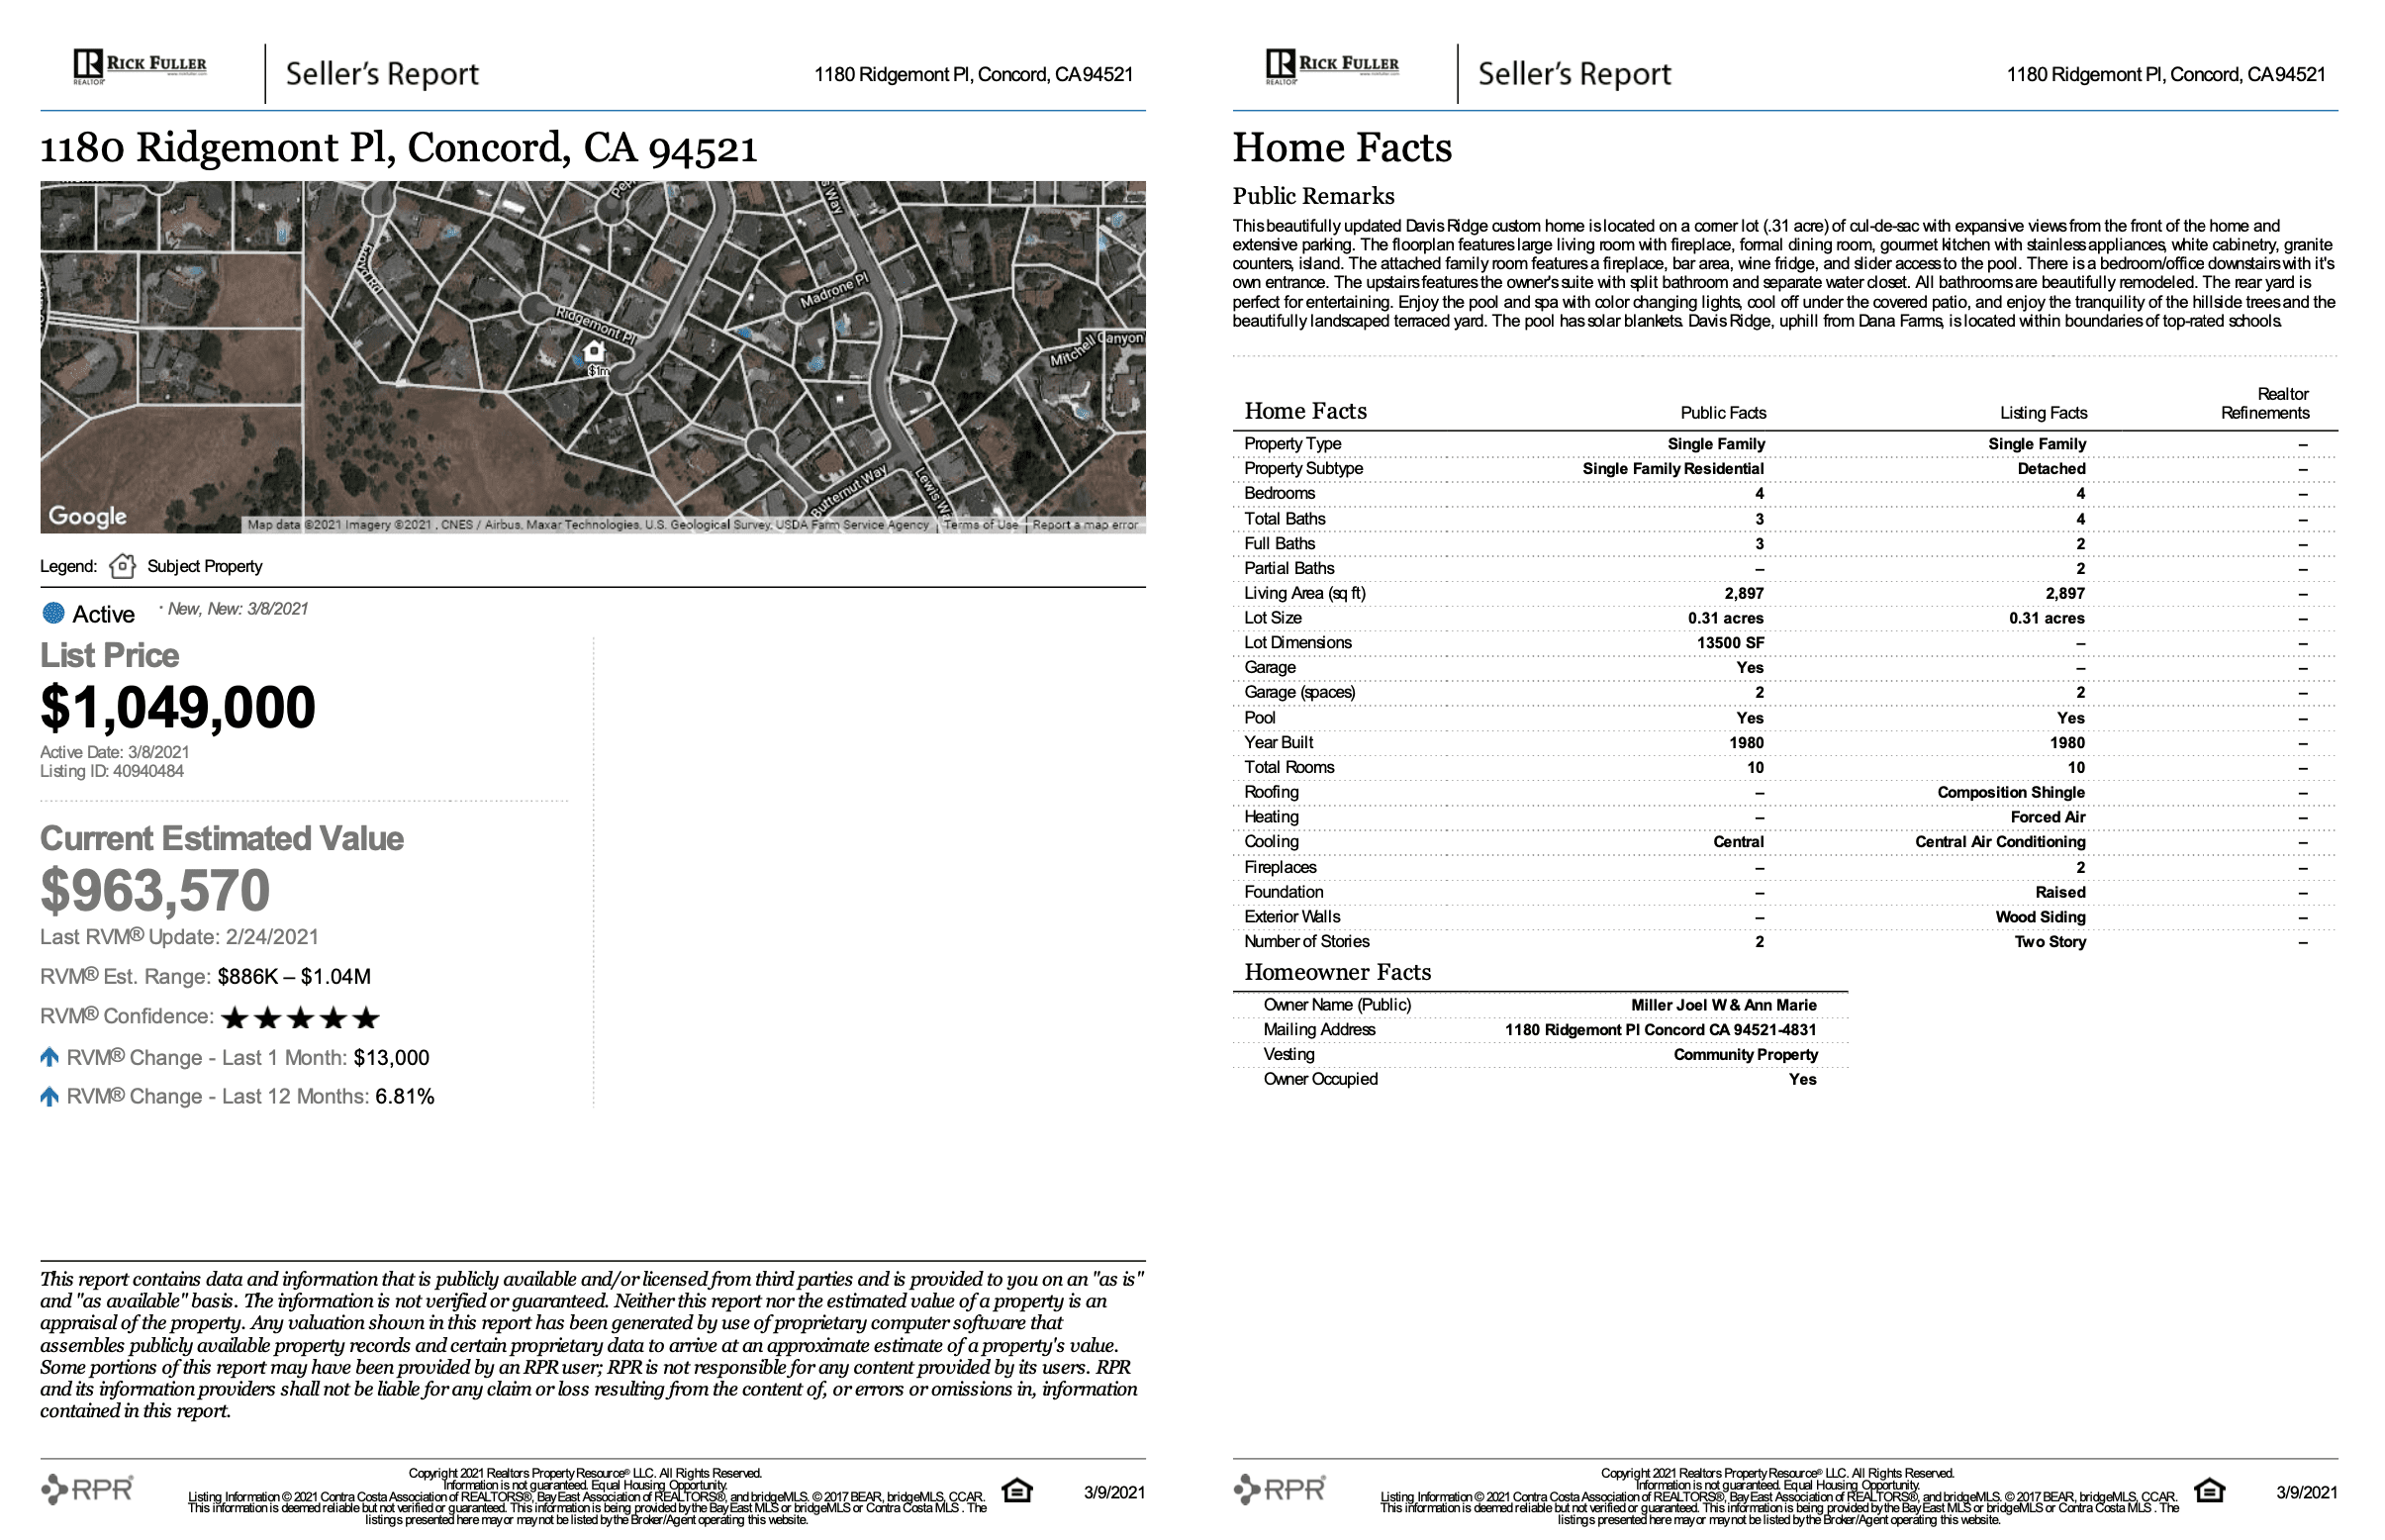
Fuller starts his CMAs with the property’s address and a map showing the lot and the surrounding properties. The CMA is typically used to price a home that hasn’t been listed yet.
Next, Fuller drills down into the main details of the home. The intro paragraph serves as an elevator pitch, touching on the highlights that will be most desirable to buyers, such as great views, kitchen and bath upgrades, interior living space, outdoor entertaining space, landscaping, and top-rated schools.
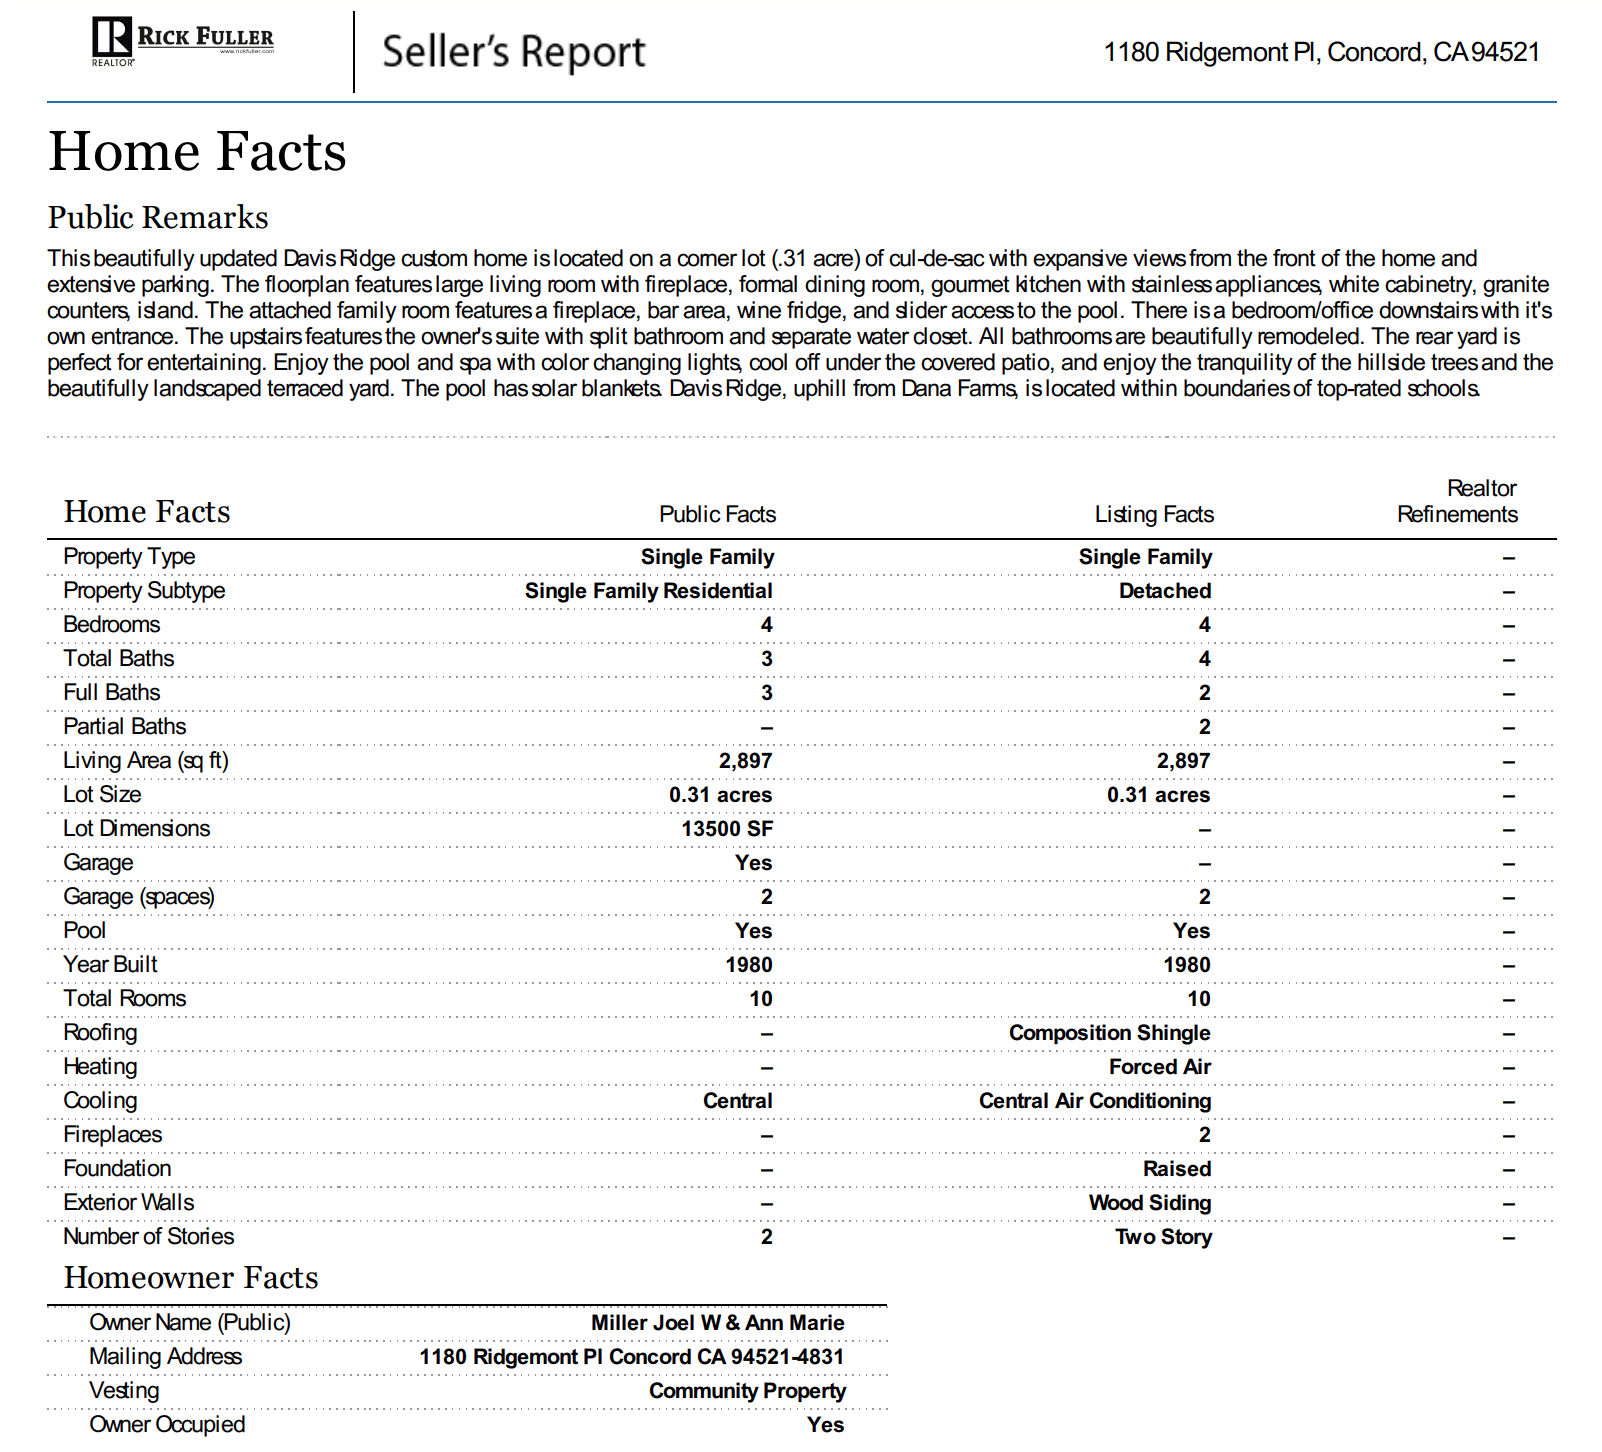
Below that is a listing of all of the specific home facts, such as the number of bedrooms and bathrooms, lot size, construction materials, age of the home, and more.
“The right upgrades, like kitchen remodels, bathroom updates, and additions can all increase the value of a home,” Fuller says.
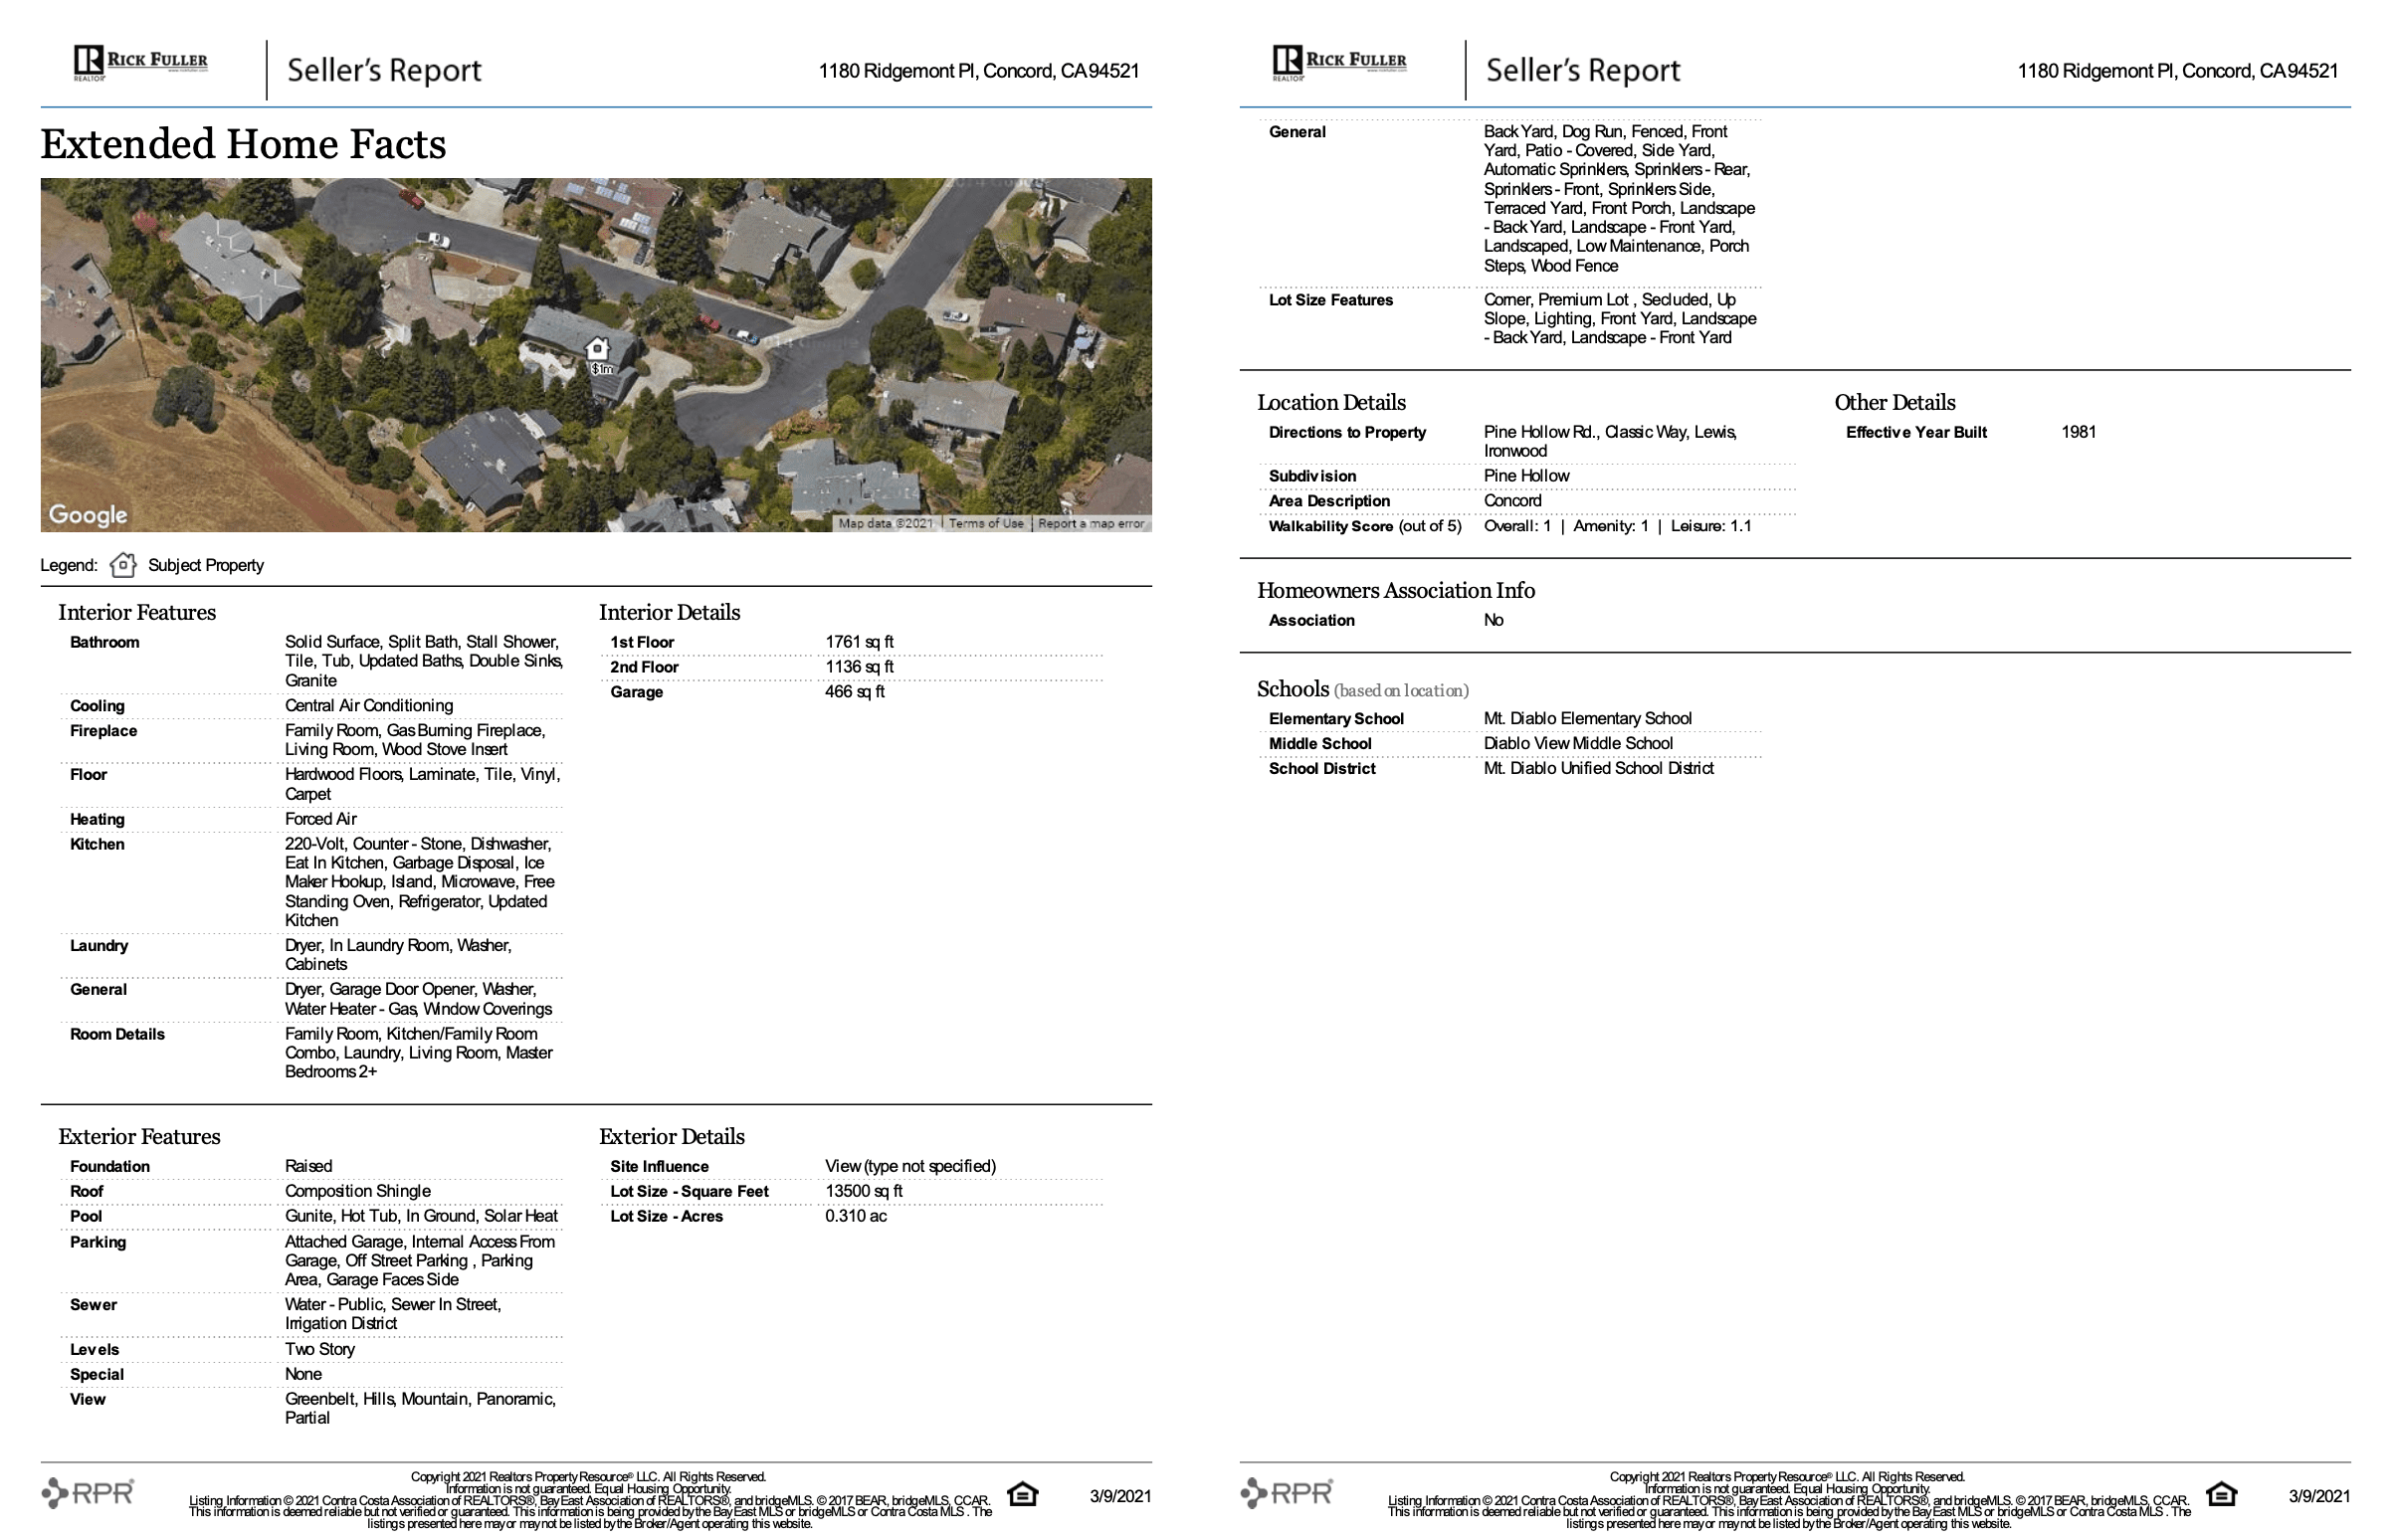
Extended home facts
Next, the CMA outlines additional property features, including:
- Interior features: Materials used in kitchen and bathrooms, HVAC systems, general features, square footage of rooms
- Exterior features: Details on the roof, foundation, parking, views, lot size, and other features
- Location details: Directions to the home, name of the community, walkability, and HOA if applicable
- Schools: Names of local schools in the district
Fuller notes that these details can have a direct impact on a home’s market value. For instance, if a property is in a highly desirable school district; next to a well-maintained park with walking trails; or has a large, private lot, those selling points can boost the list price.
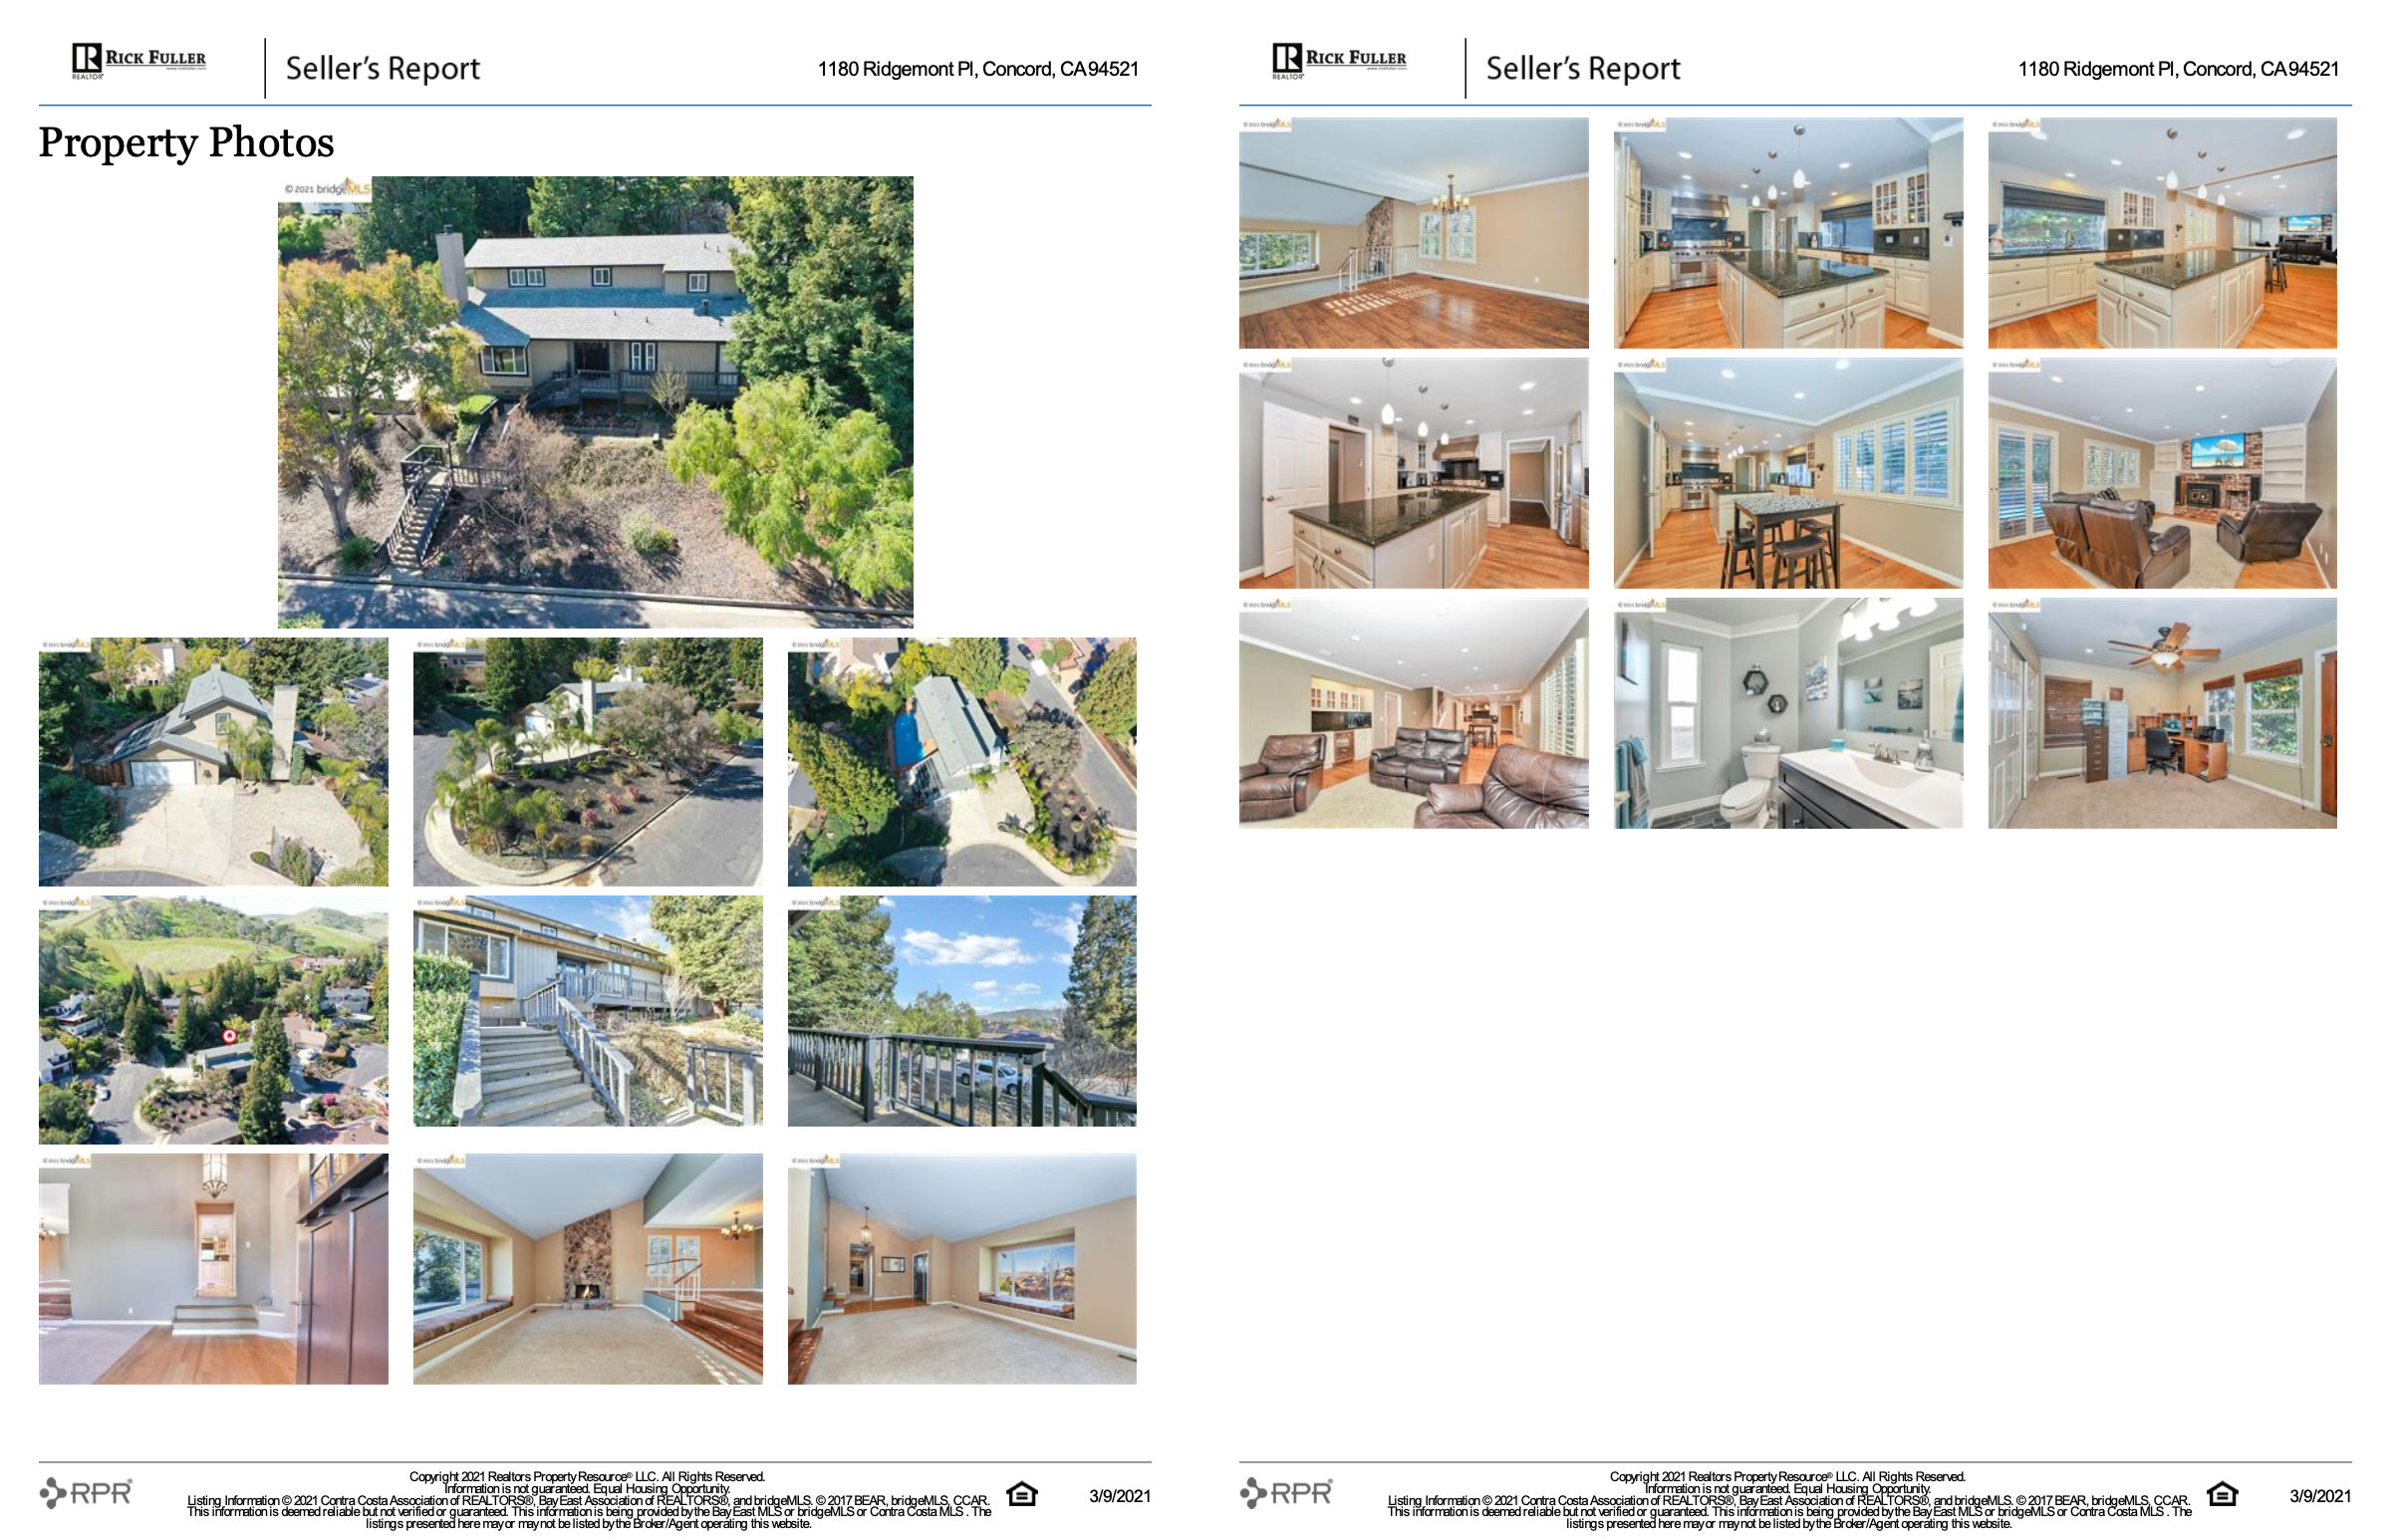
Property photos
These days, almost every real estate sale starts with an image — or several. According to the National Association of Realtors’ 2020 Generational Trends Report, photography was the most important online feature when shopping for a home among almost 90% of buyers under the age of 55, and some studies have shown that quality photos can help homes sell up to 32% faster.
When creating a new CMA, the agent hasn’t yet hired a professional photographer for a photo shoot. Fuller likes to include any pre-existing images of the property, perhaps from Google Maps or from a time when the home was previously listed, to provide some context and personalize the report as shown below.
Property history
This page shows how the property’s estimated home value compares to the values of other homes in the same ZIP code, county, and state, based on public records and MLS sources. It also includes all of the home’s previous sales and its assessed values and taxes for each year.
“I like to include this type of historical information to help determine the cost basis and equity accumulated,” Fuller says.

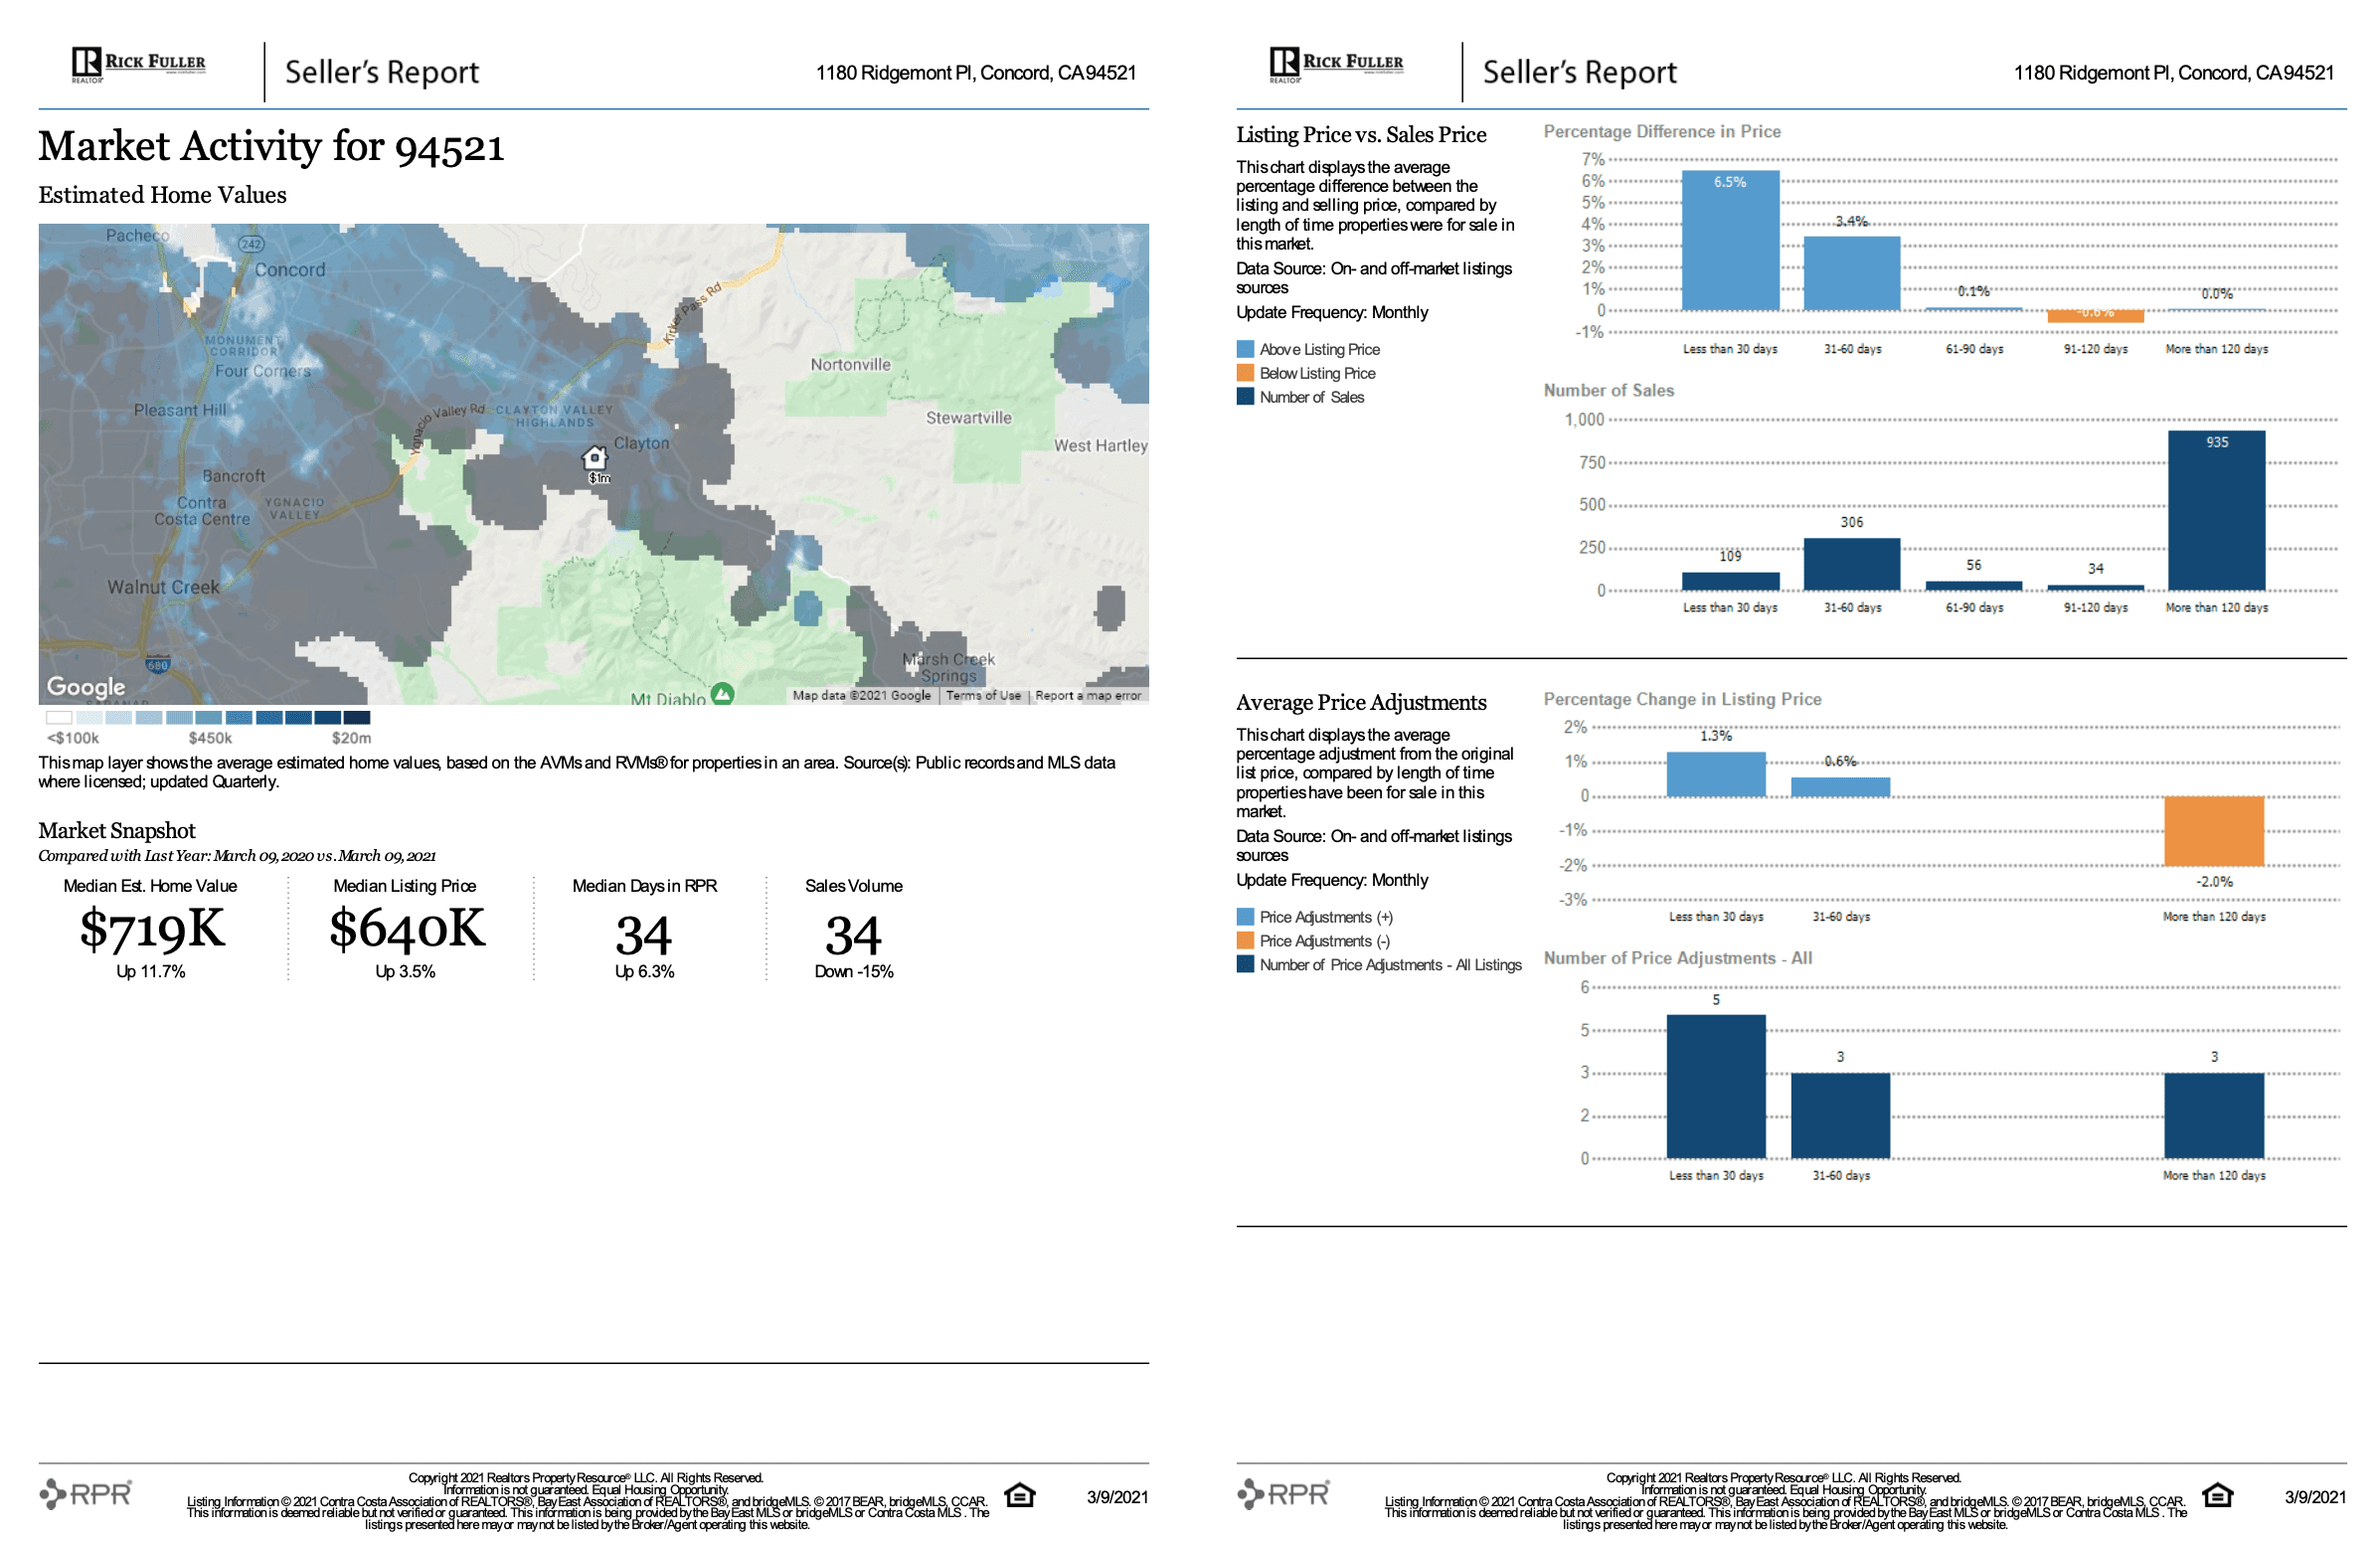
Market activity
This section shows a snapshot of the state of the market in the ZIP code where the property is located. Here, the seller can see:
- The median home value, median listing price, median days on the market, and sales volume as compared to the same month in the prior year
- A list-to-sale price ratio that shows how many properties sold above and below the listing price
- A summary of price adjustments made to listed properties on a monthly basis
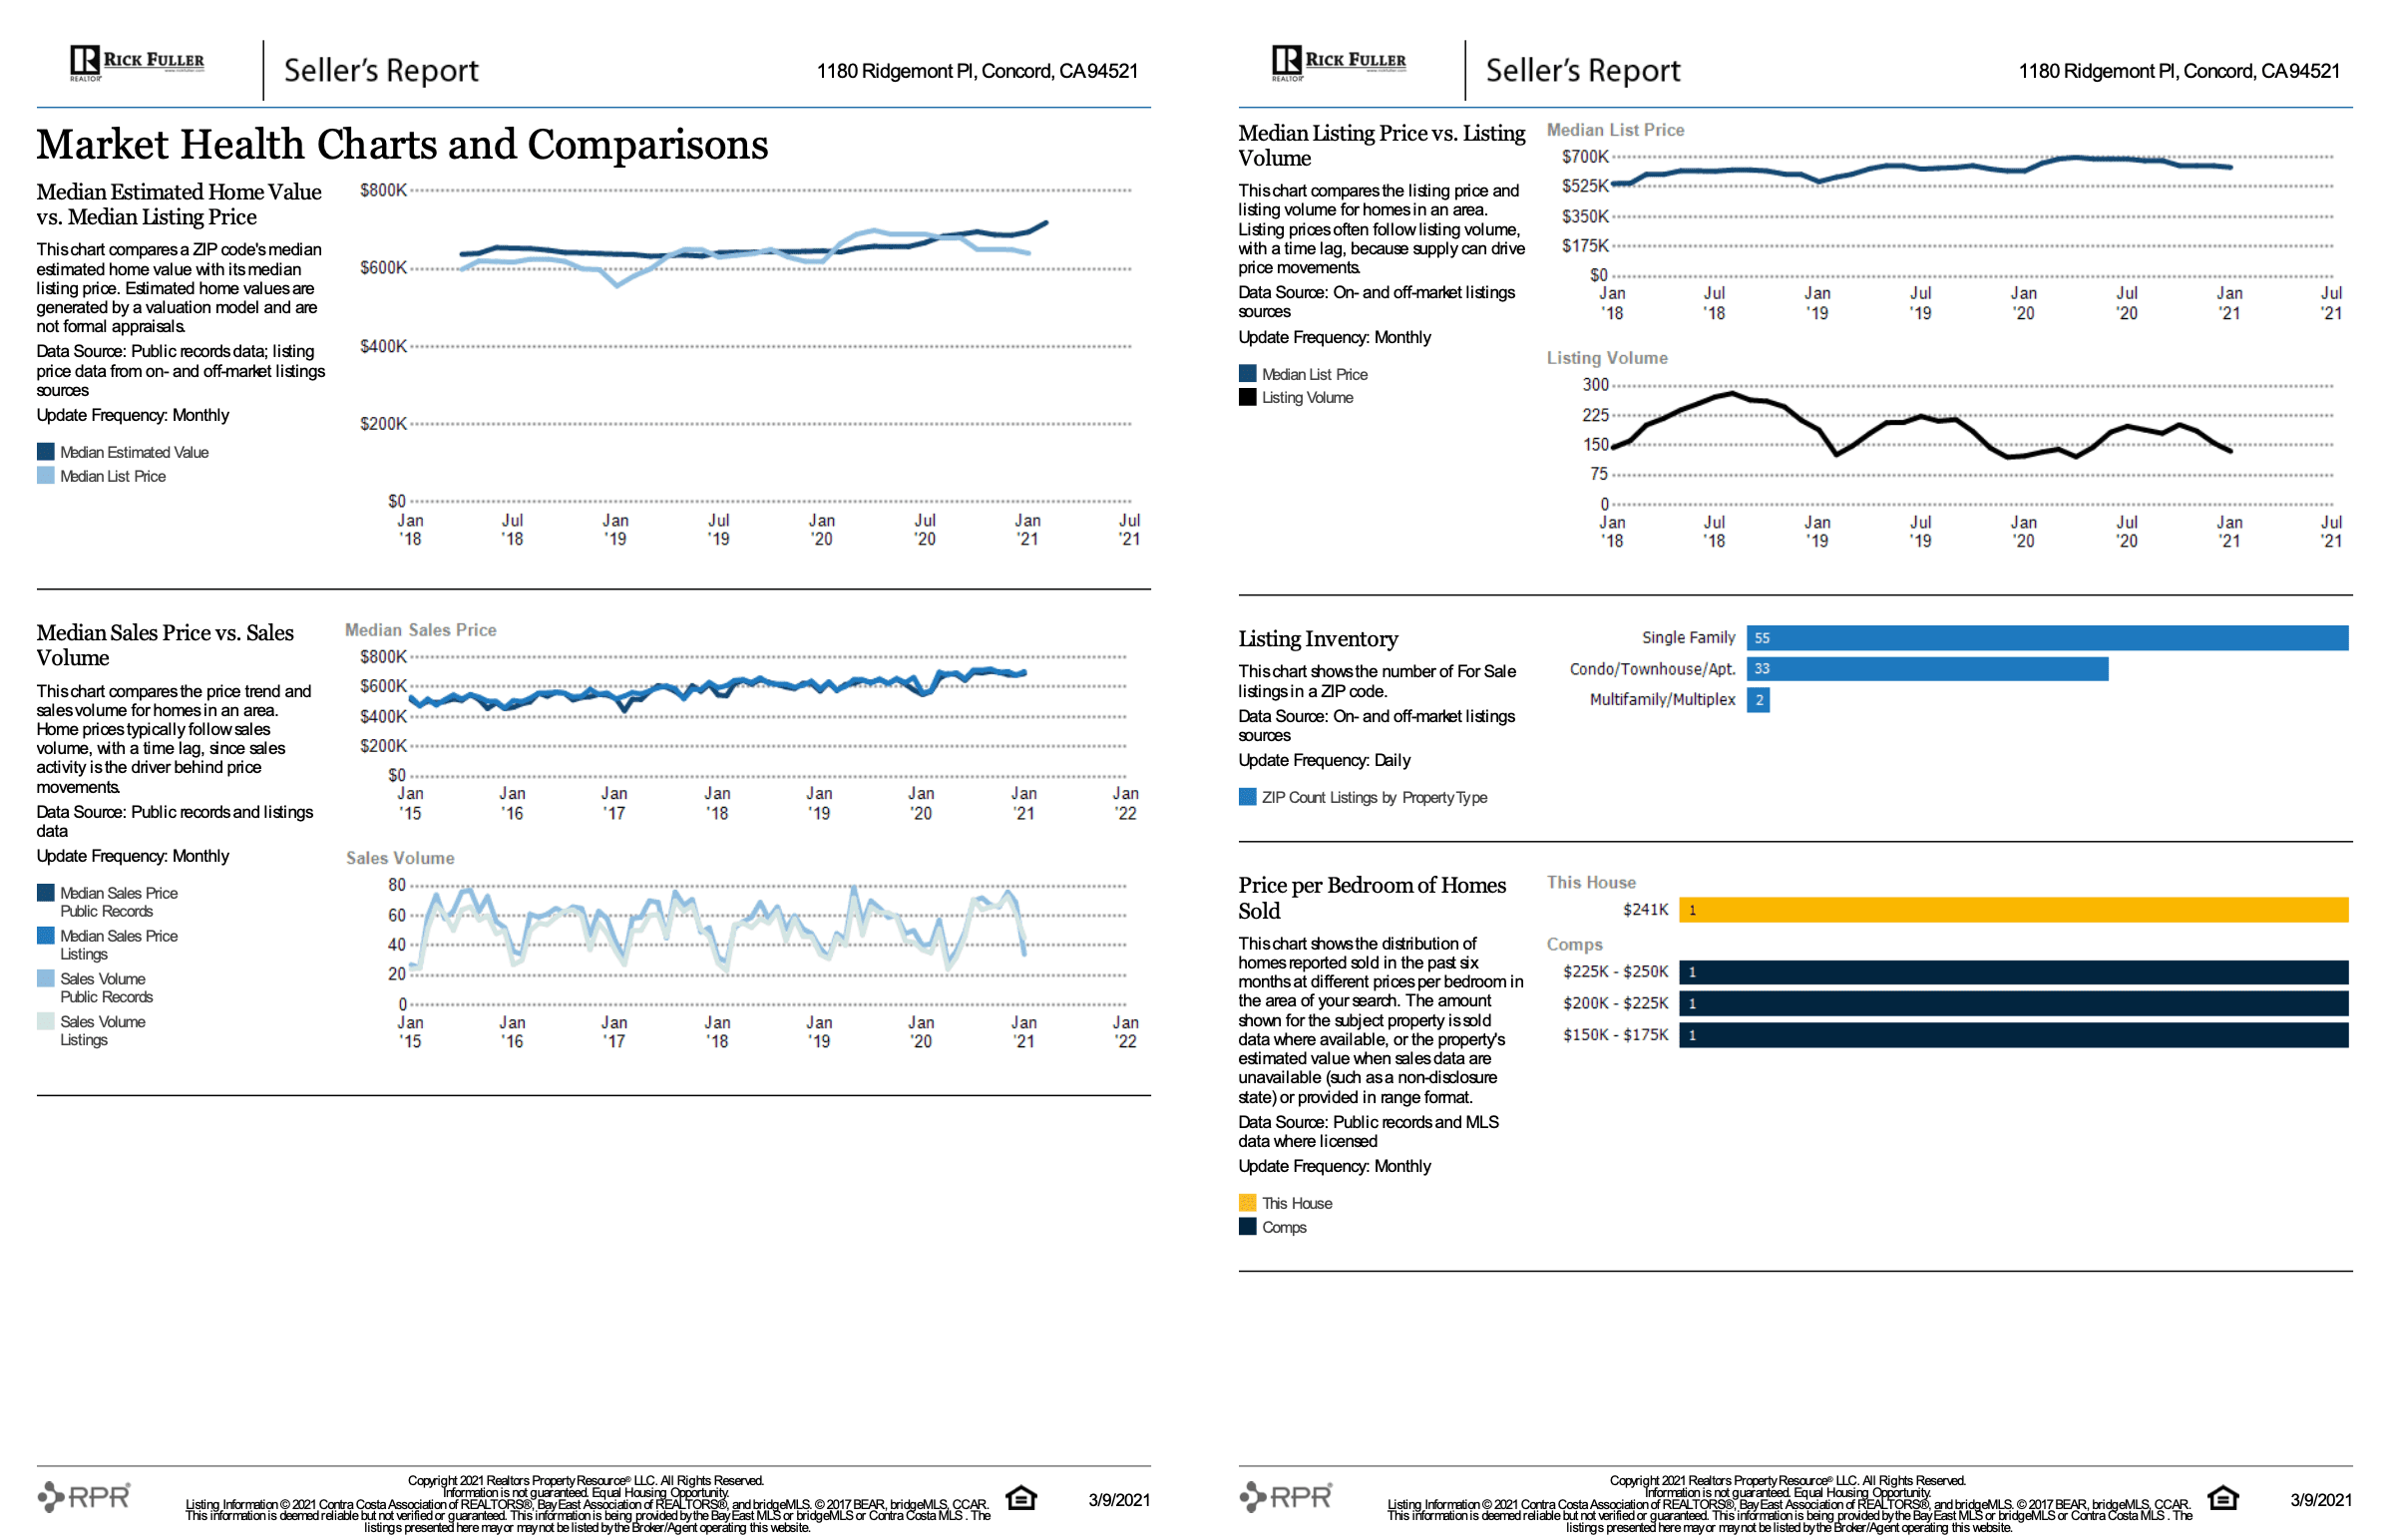
Market health charts and comparisons
Fuller’s CMA dives even deeper into the current market with charts that show key information about what’s selling (and for how much):
- Estimated home value vs. estimated median list price
- Median sale price vs. sales volume
- Median listing price vs. listing volume
- Types of listing inventory
- Price per bedroom of homes sold
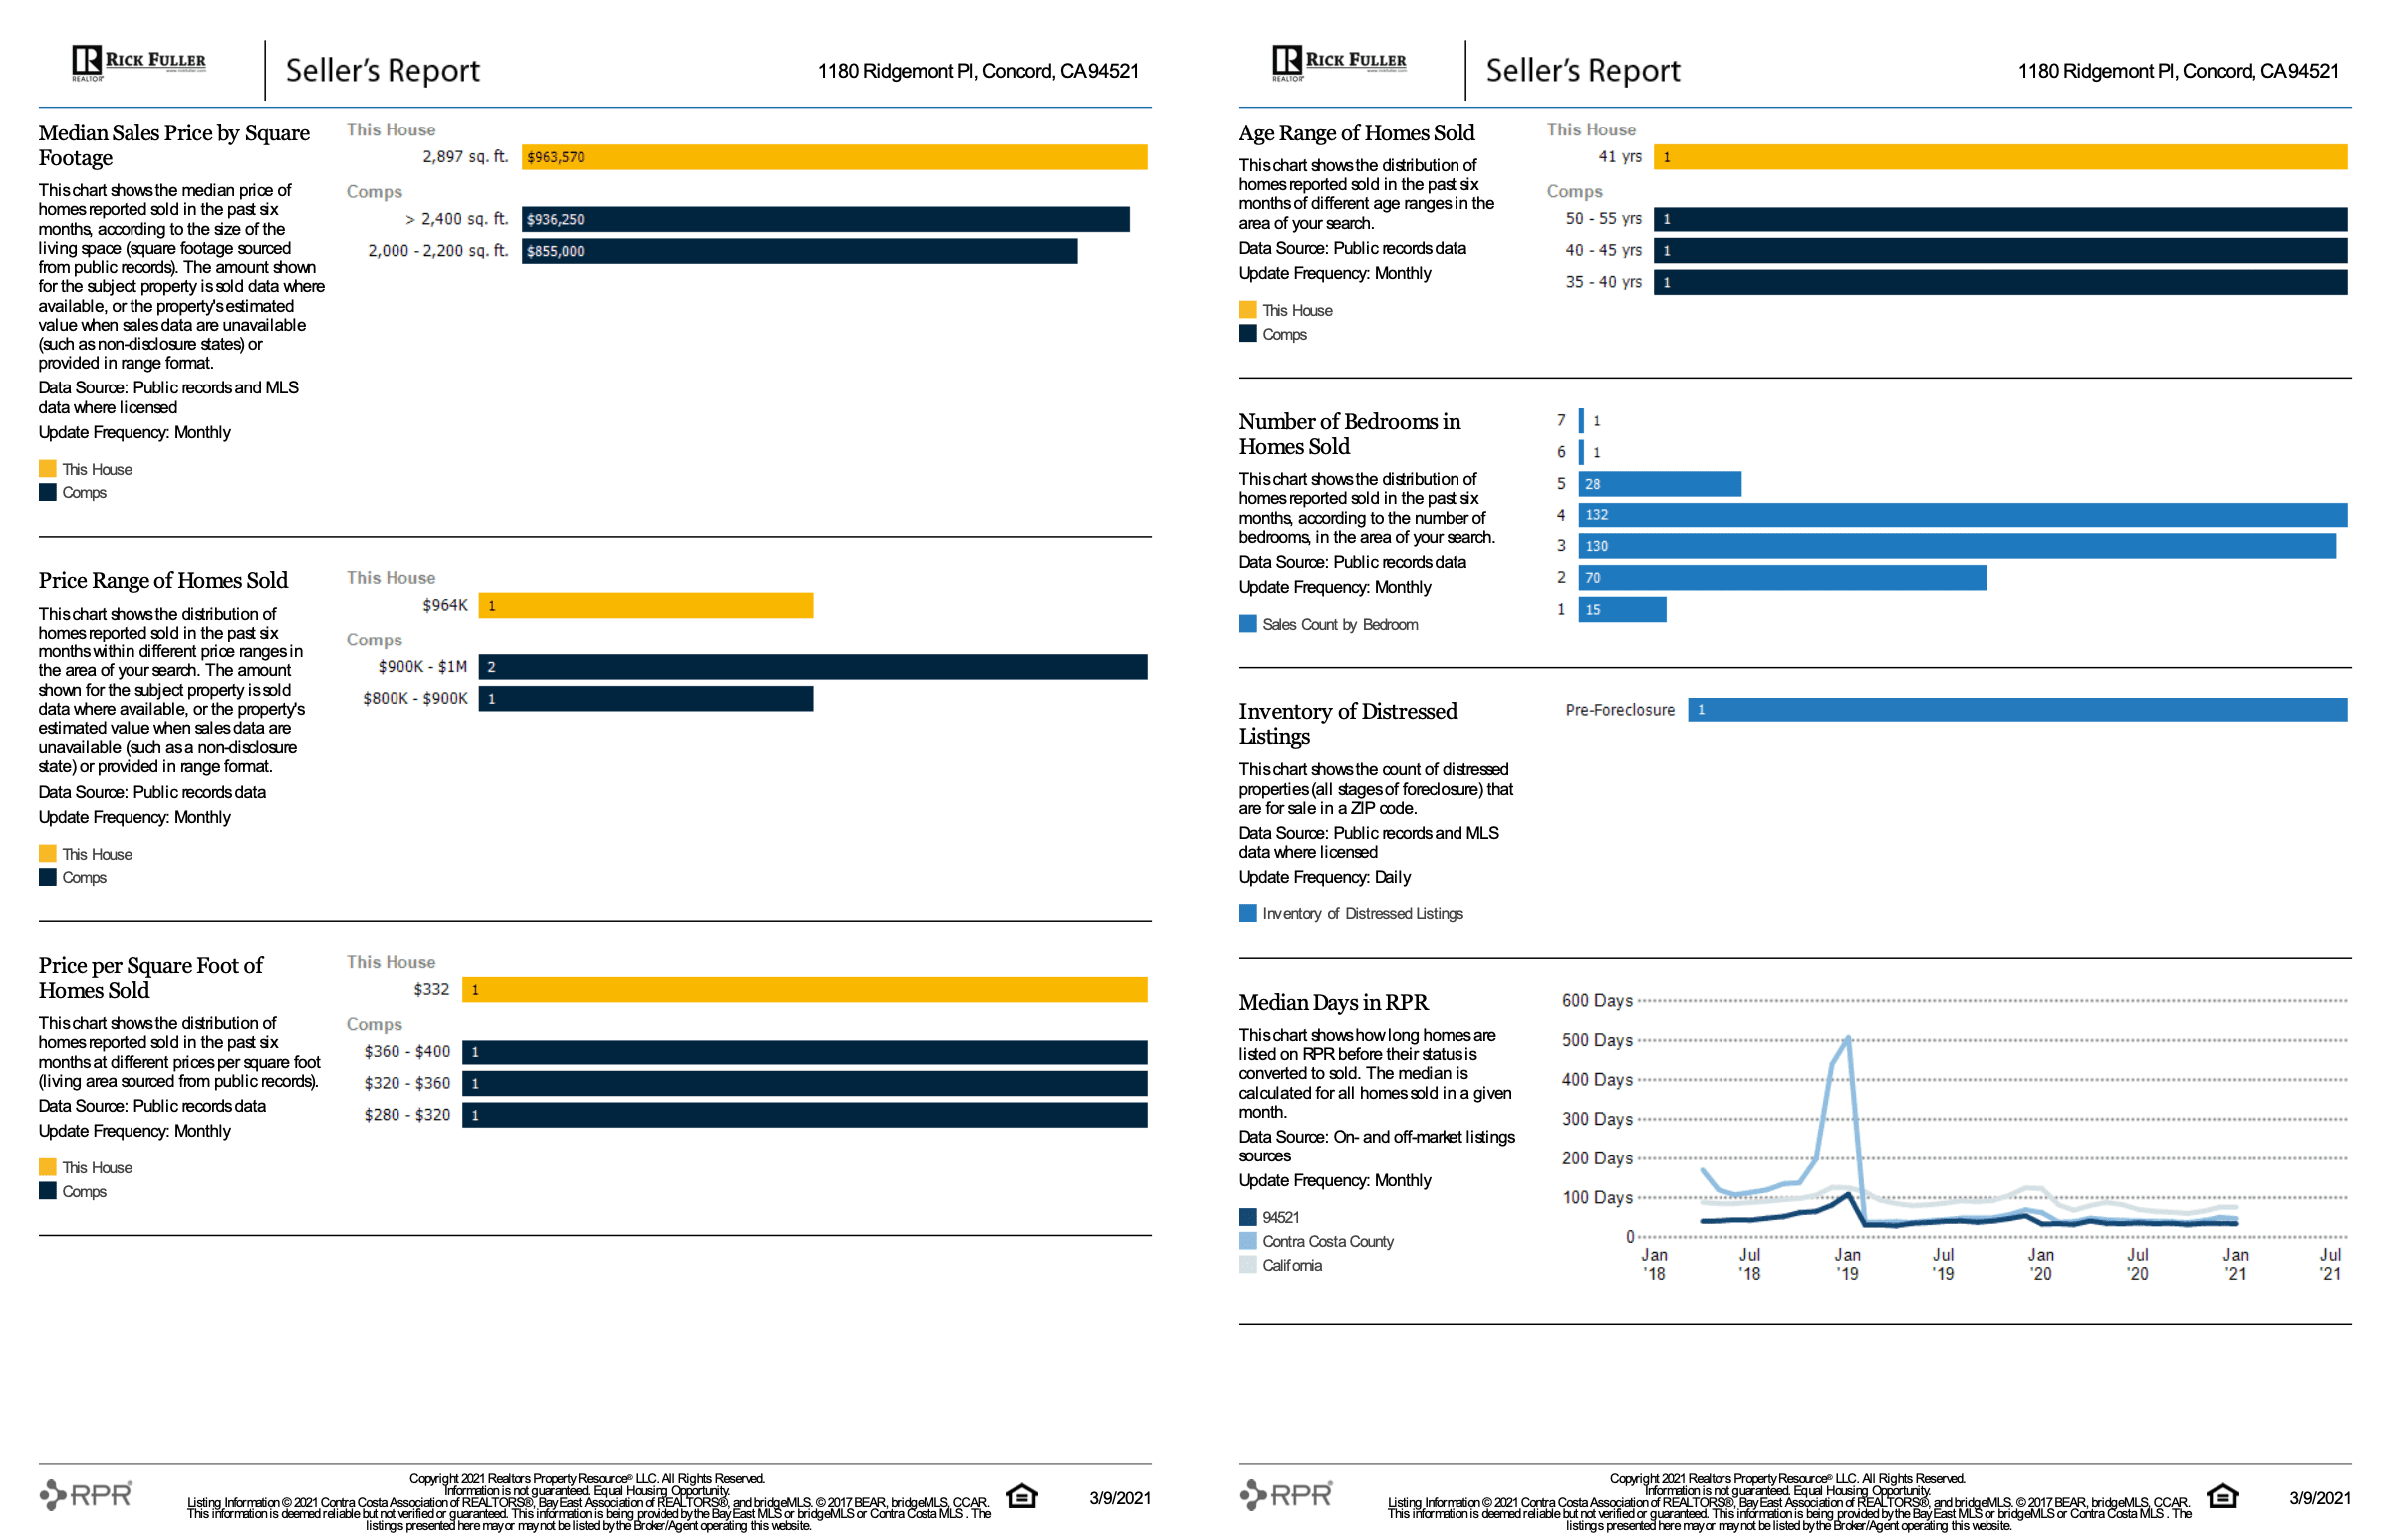
- Median sale price by square footage
- Price range of sold homes
- Price per square foot of homes sold
- Age range of homes sold
- Number of bedrooms in homes sold
- Inventory of distressed listings
“Market health is significant as rising home values, low inventory, and neighborhood desirability all influence property values,” says Fuller.

Select recent market activity
This section shows a map with a general snapshot of what’s been happening in the local market lately. The seller can easily see the total number of active, pending, distressed, expired, and closed listings, along with the low, median, and high listing prices. This overview also shows the median living area, price per square footage, and age of properties in each category.

Comparable properties (comps)
At the heart of every CMA are the comps, which are comparable properties in the area that are currently on the market, have been recently sold, have a pending offer, or were on the market but were later removed.
When choosing which comps to include in his CMAs, a property generally must meet some key criteria:
- It sold or was listed within the last six months.
- Its size is within 20% of the square footage (interior and exterior) of the subject property.
- It’s located within the same community or a similar community.
- It’s the closest possible proximity to the subject property.
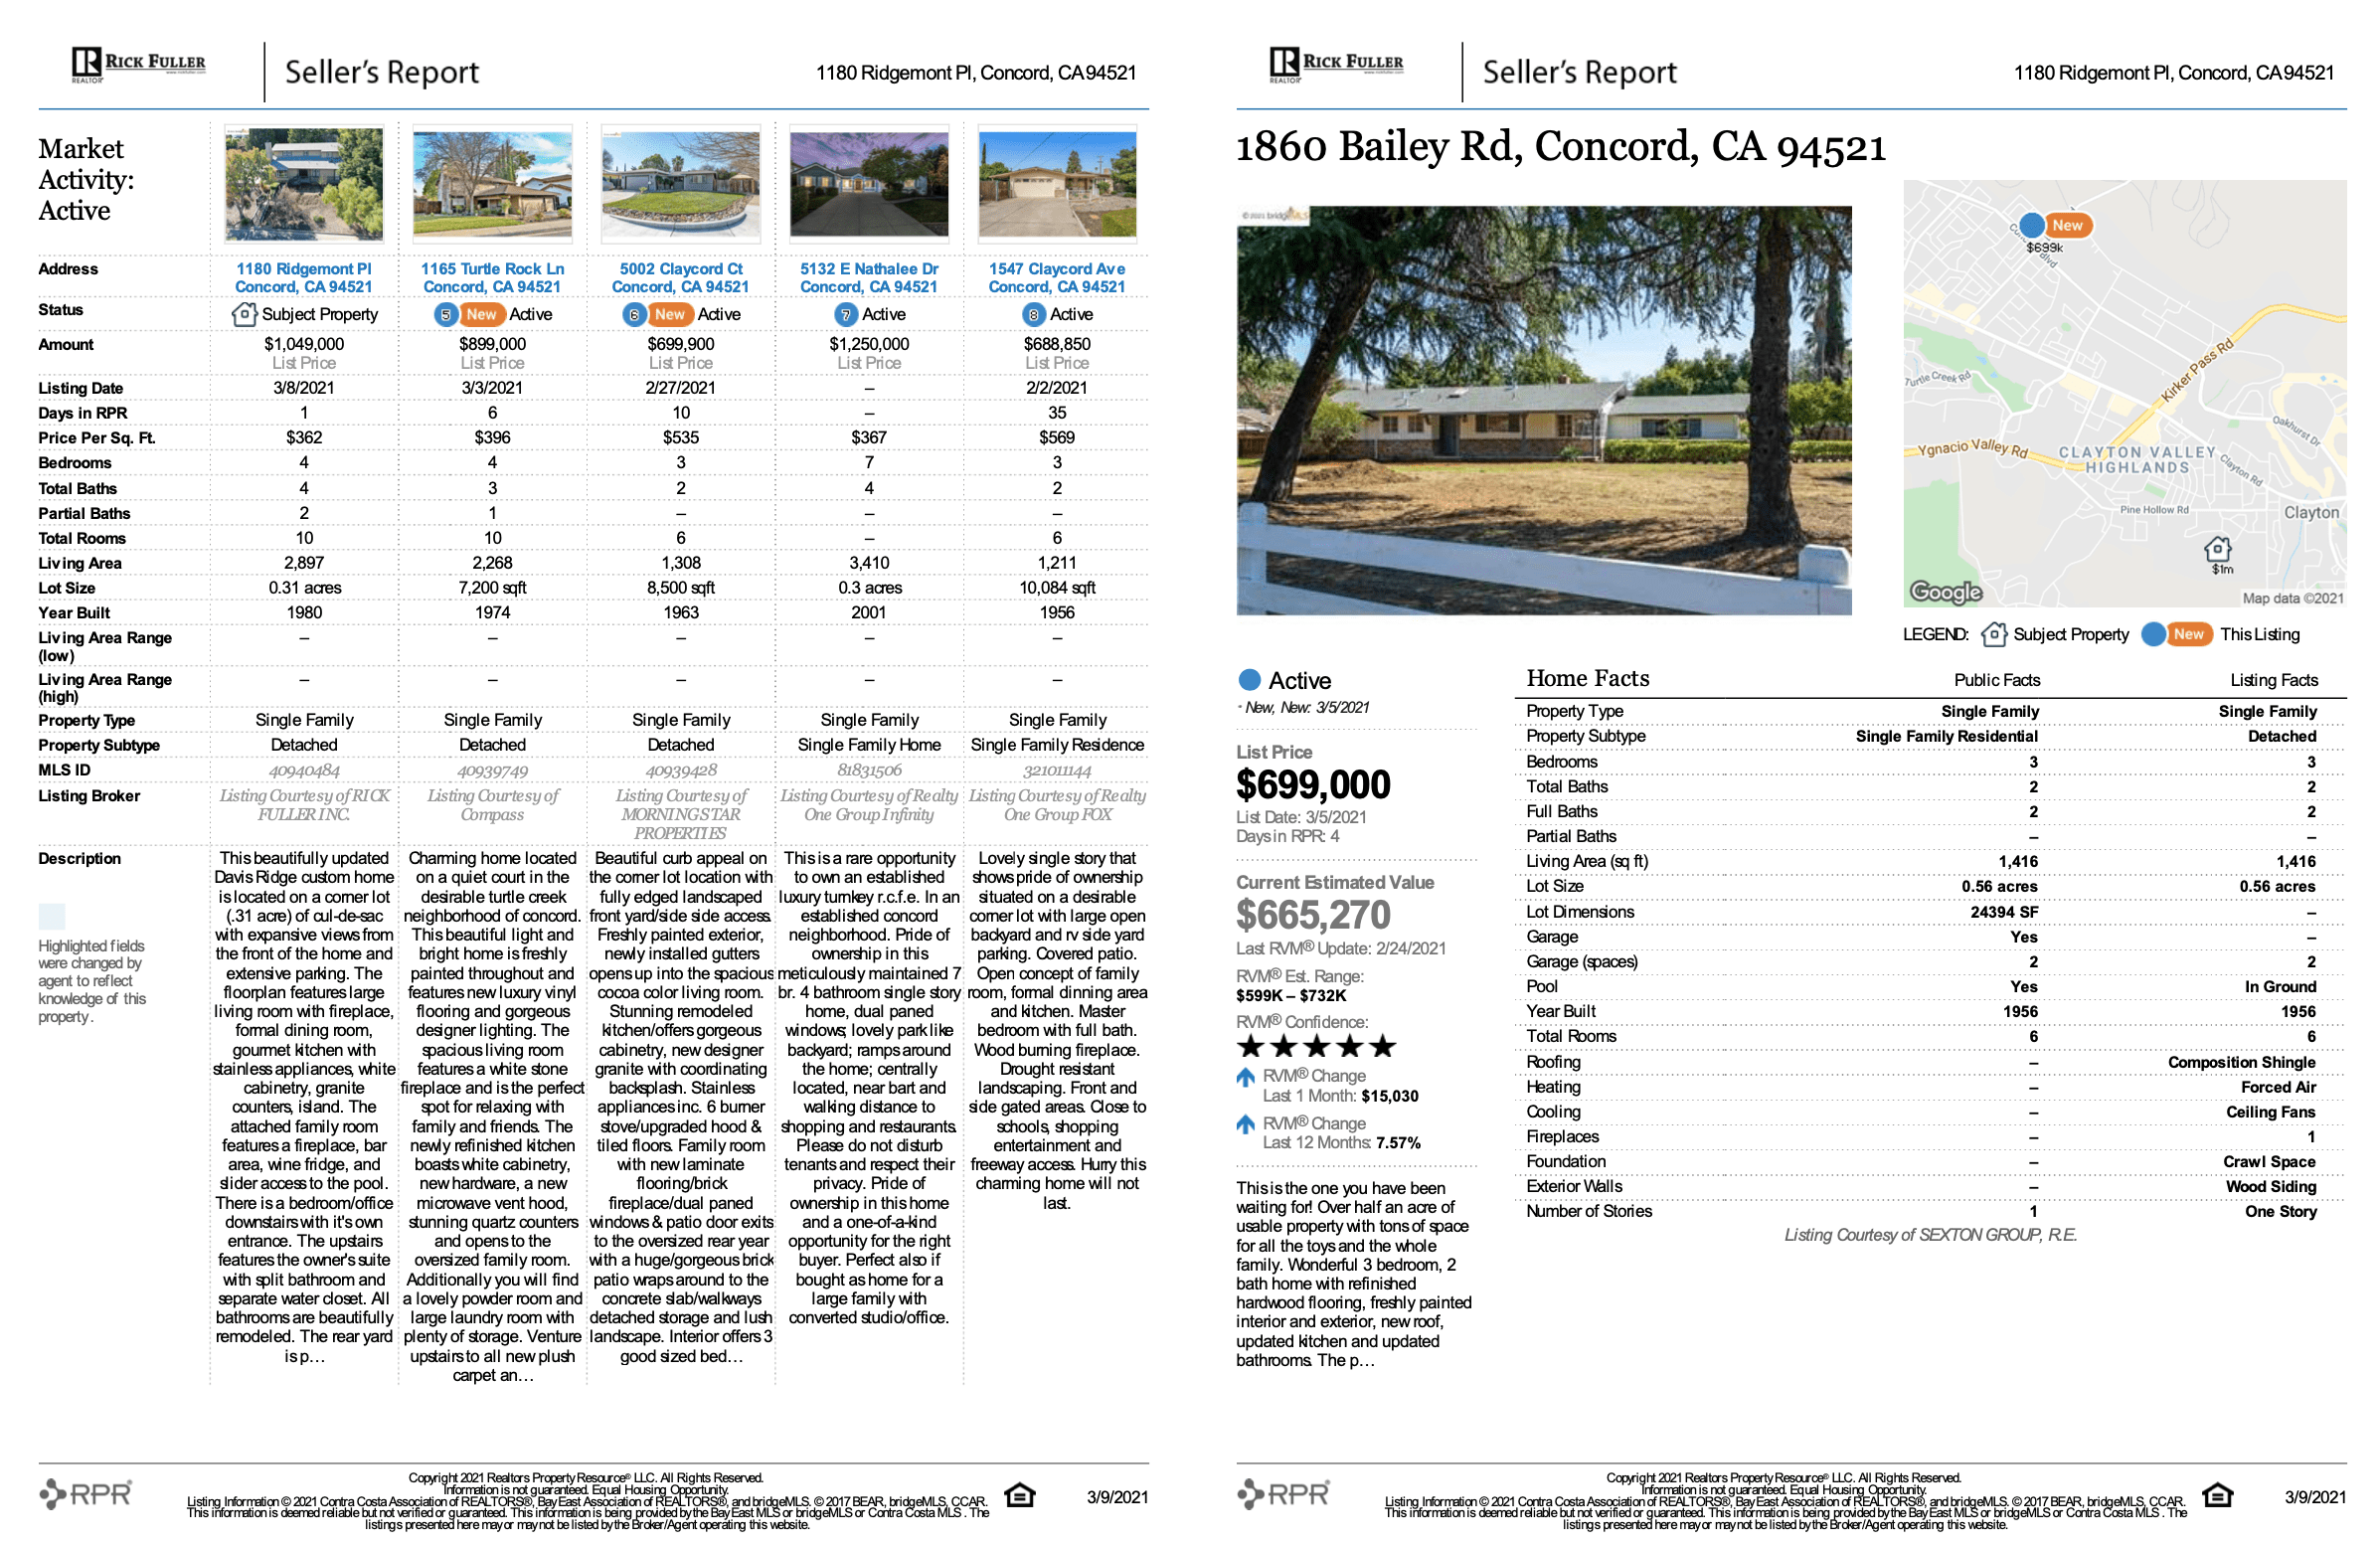
Active properties
In this CMA, Fuller starts by providing a chart of a selected number of active listings in the area. These are homes that are currently for sale in the local market. The chart offers a quick comparison of key information for each property, including the address, list price, listing date, number of bedrooms and bathrooms, square footage, lot size, age, the MLS listing number, the listing broker, and a description. Next, there is a dedicated page for each of the active properties, showing a photo, map, and additional details.
“Active properties are very helpful in determining the listing price, because they show us what’s happening in the market in real time,” Fuller explains. “A seller who has priced a home significantly higher and is successful has pushed the boundaries of the market, while a seller who has priced on the high end and is not selling has pushed the boundaries too far, outside the scope of what buyers will pay.”
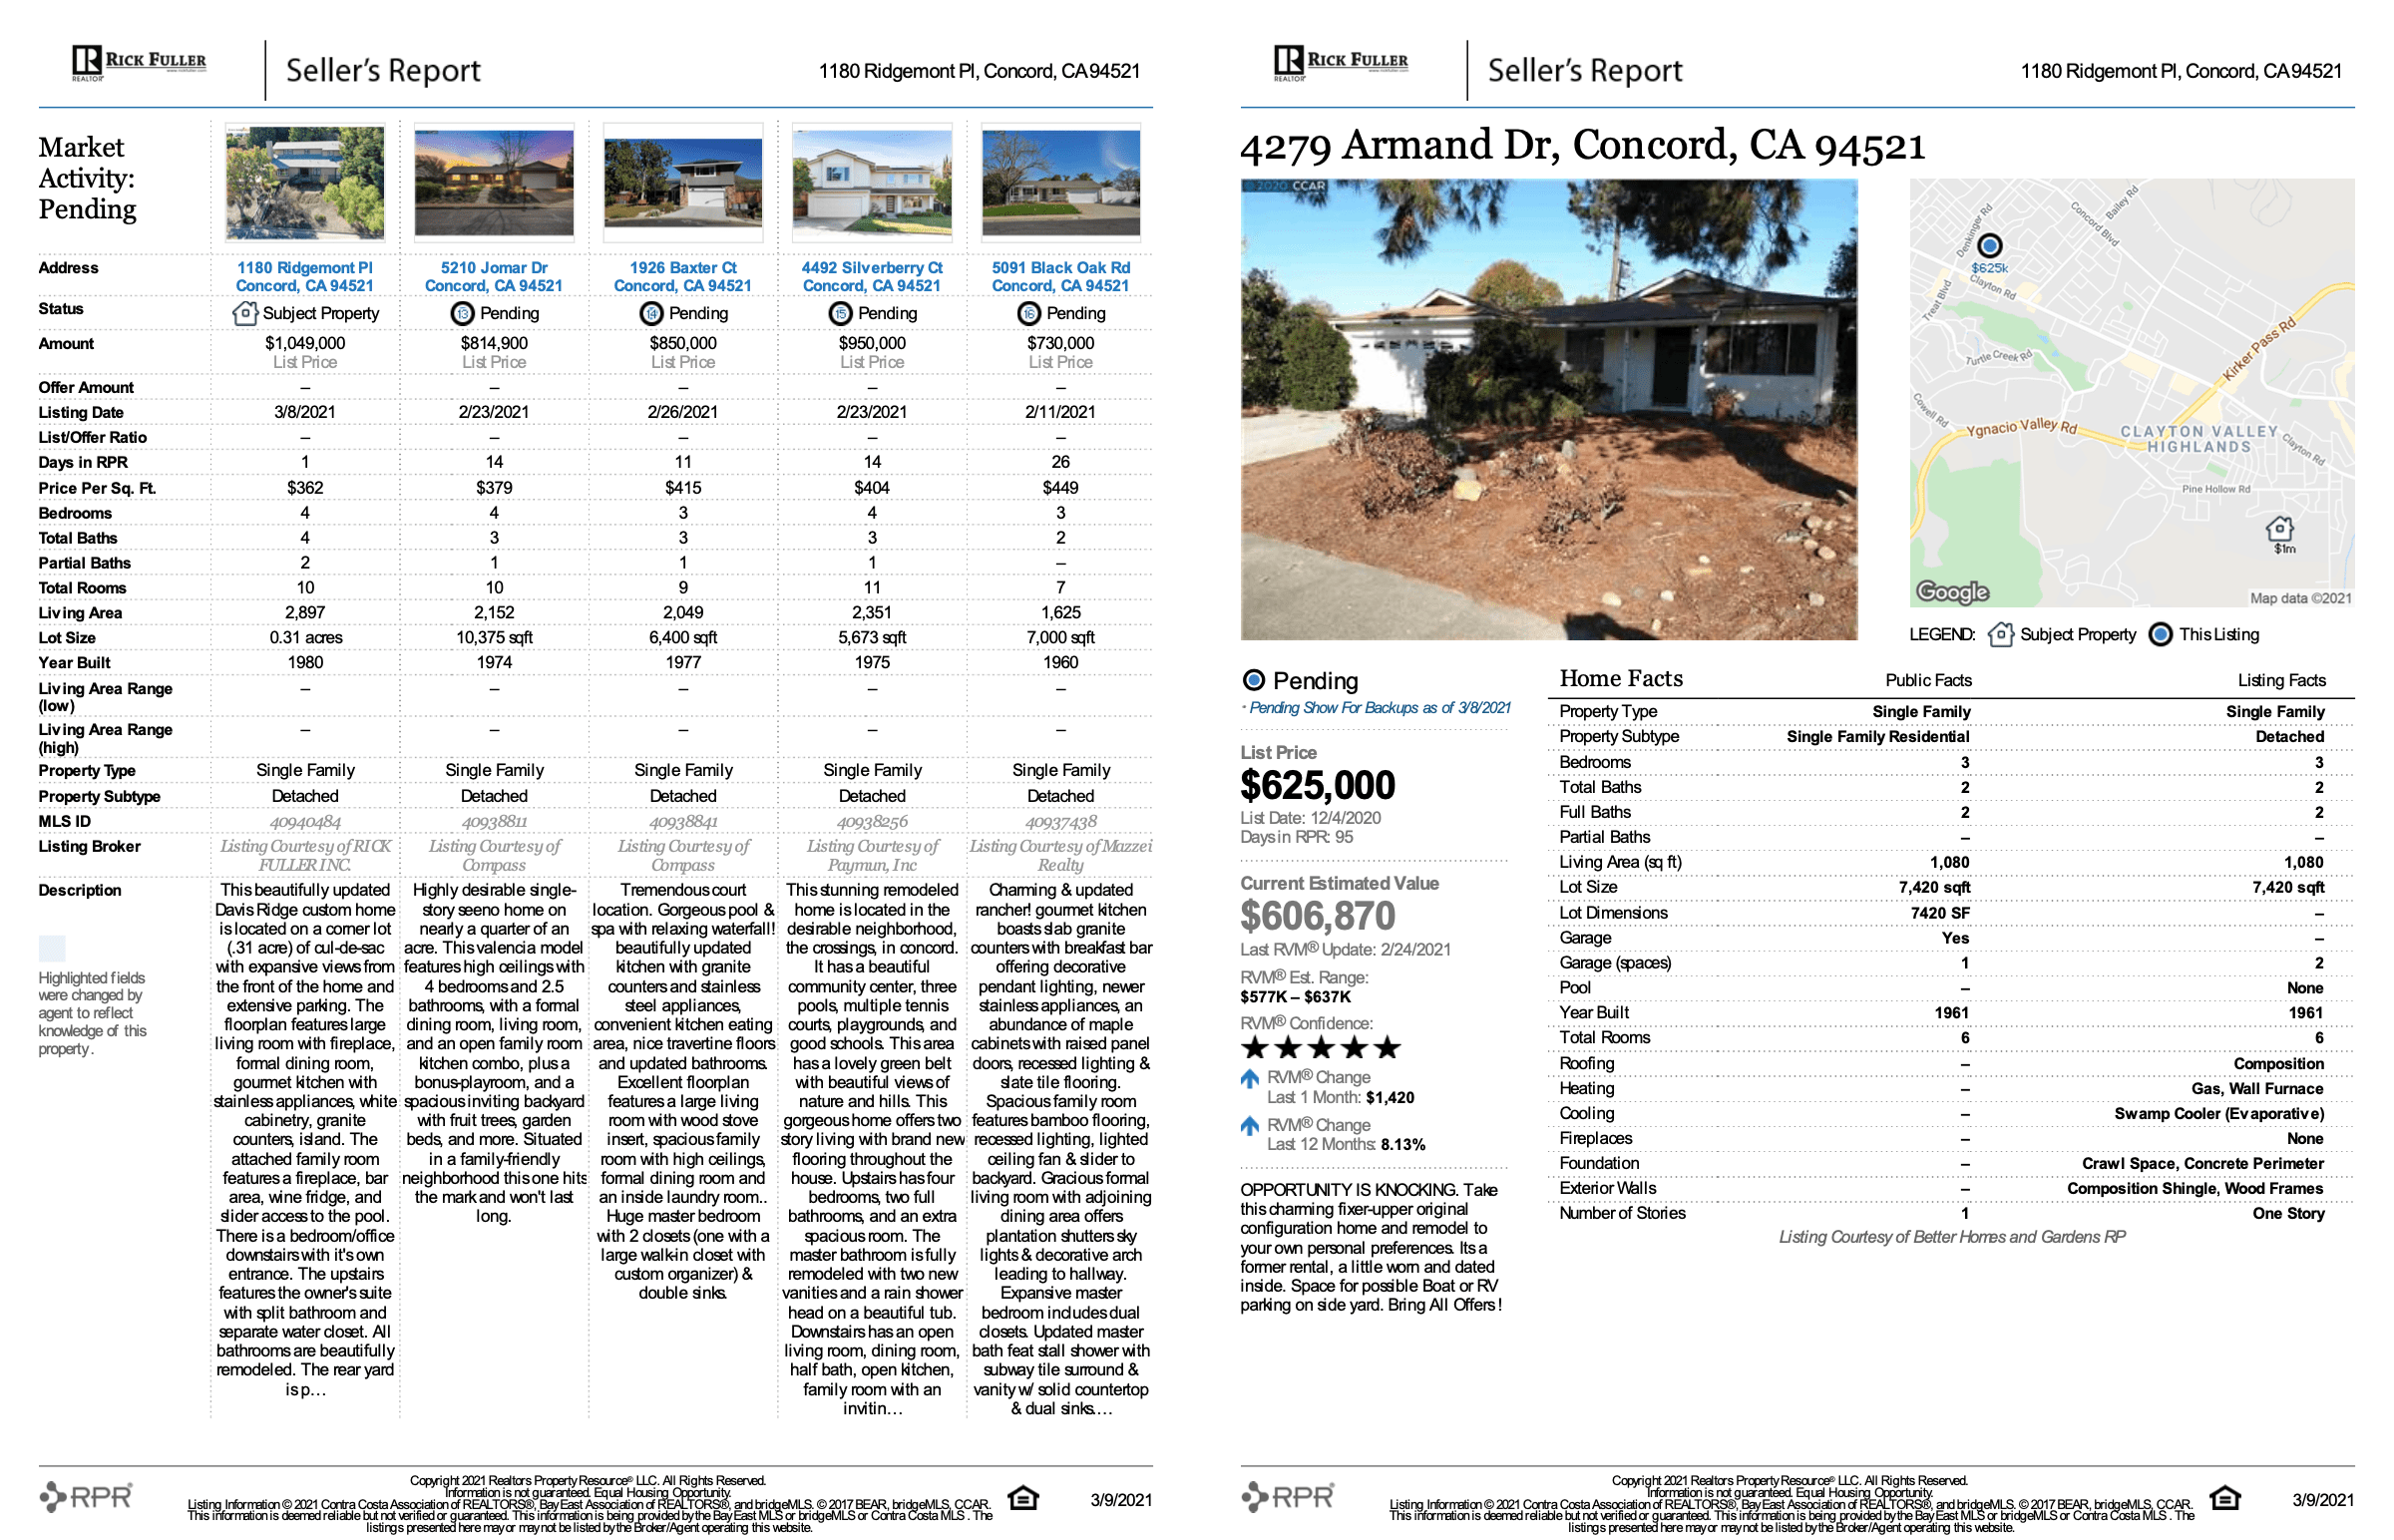
Pending properties
Pending properties are homes that have had an offer accepted and have gone under contract within the past several months, but have not closed yet. “These properties tested the market and were successful,” says Fuller. “They show a real-time pulse of what’s happening in the market, with the most accurate and most recent value.”
As with the active properties, Fuller’s CMA includes a comparison chart of selected pending homes, then provides a detailed page for each of those properties.
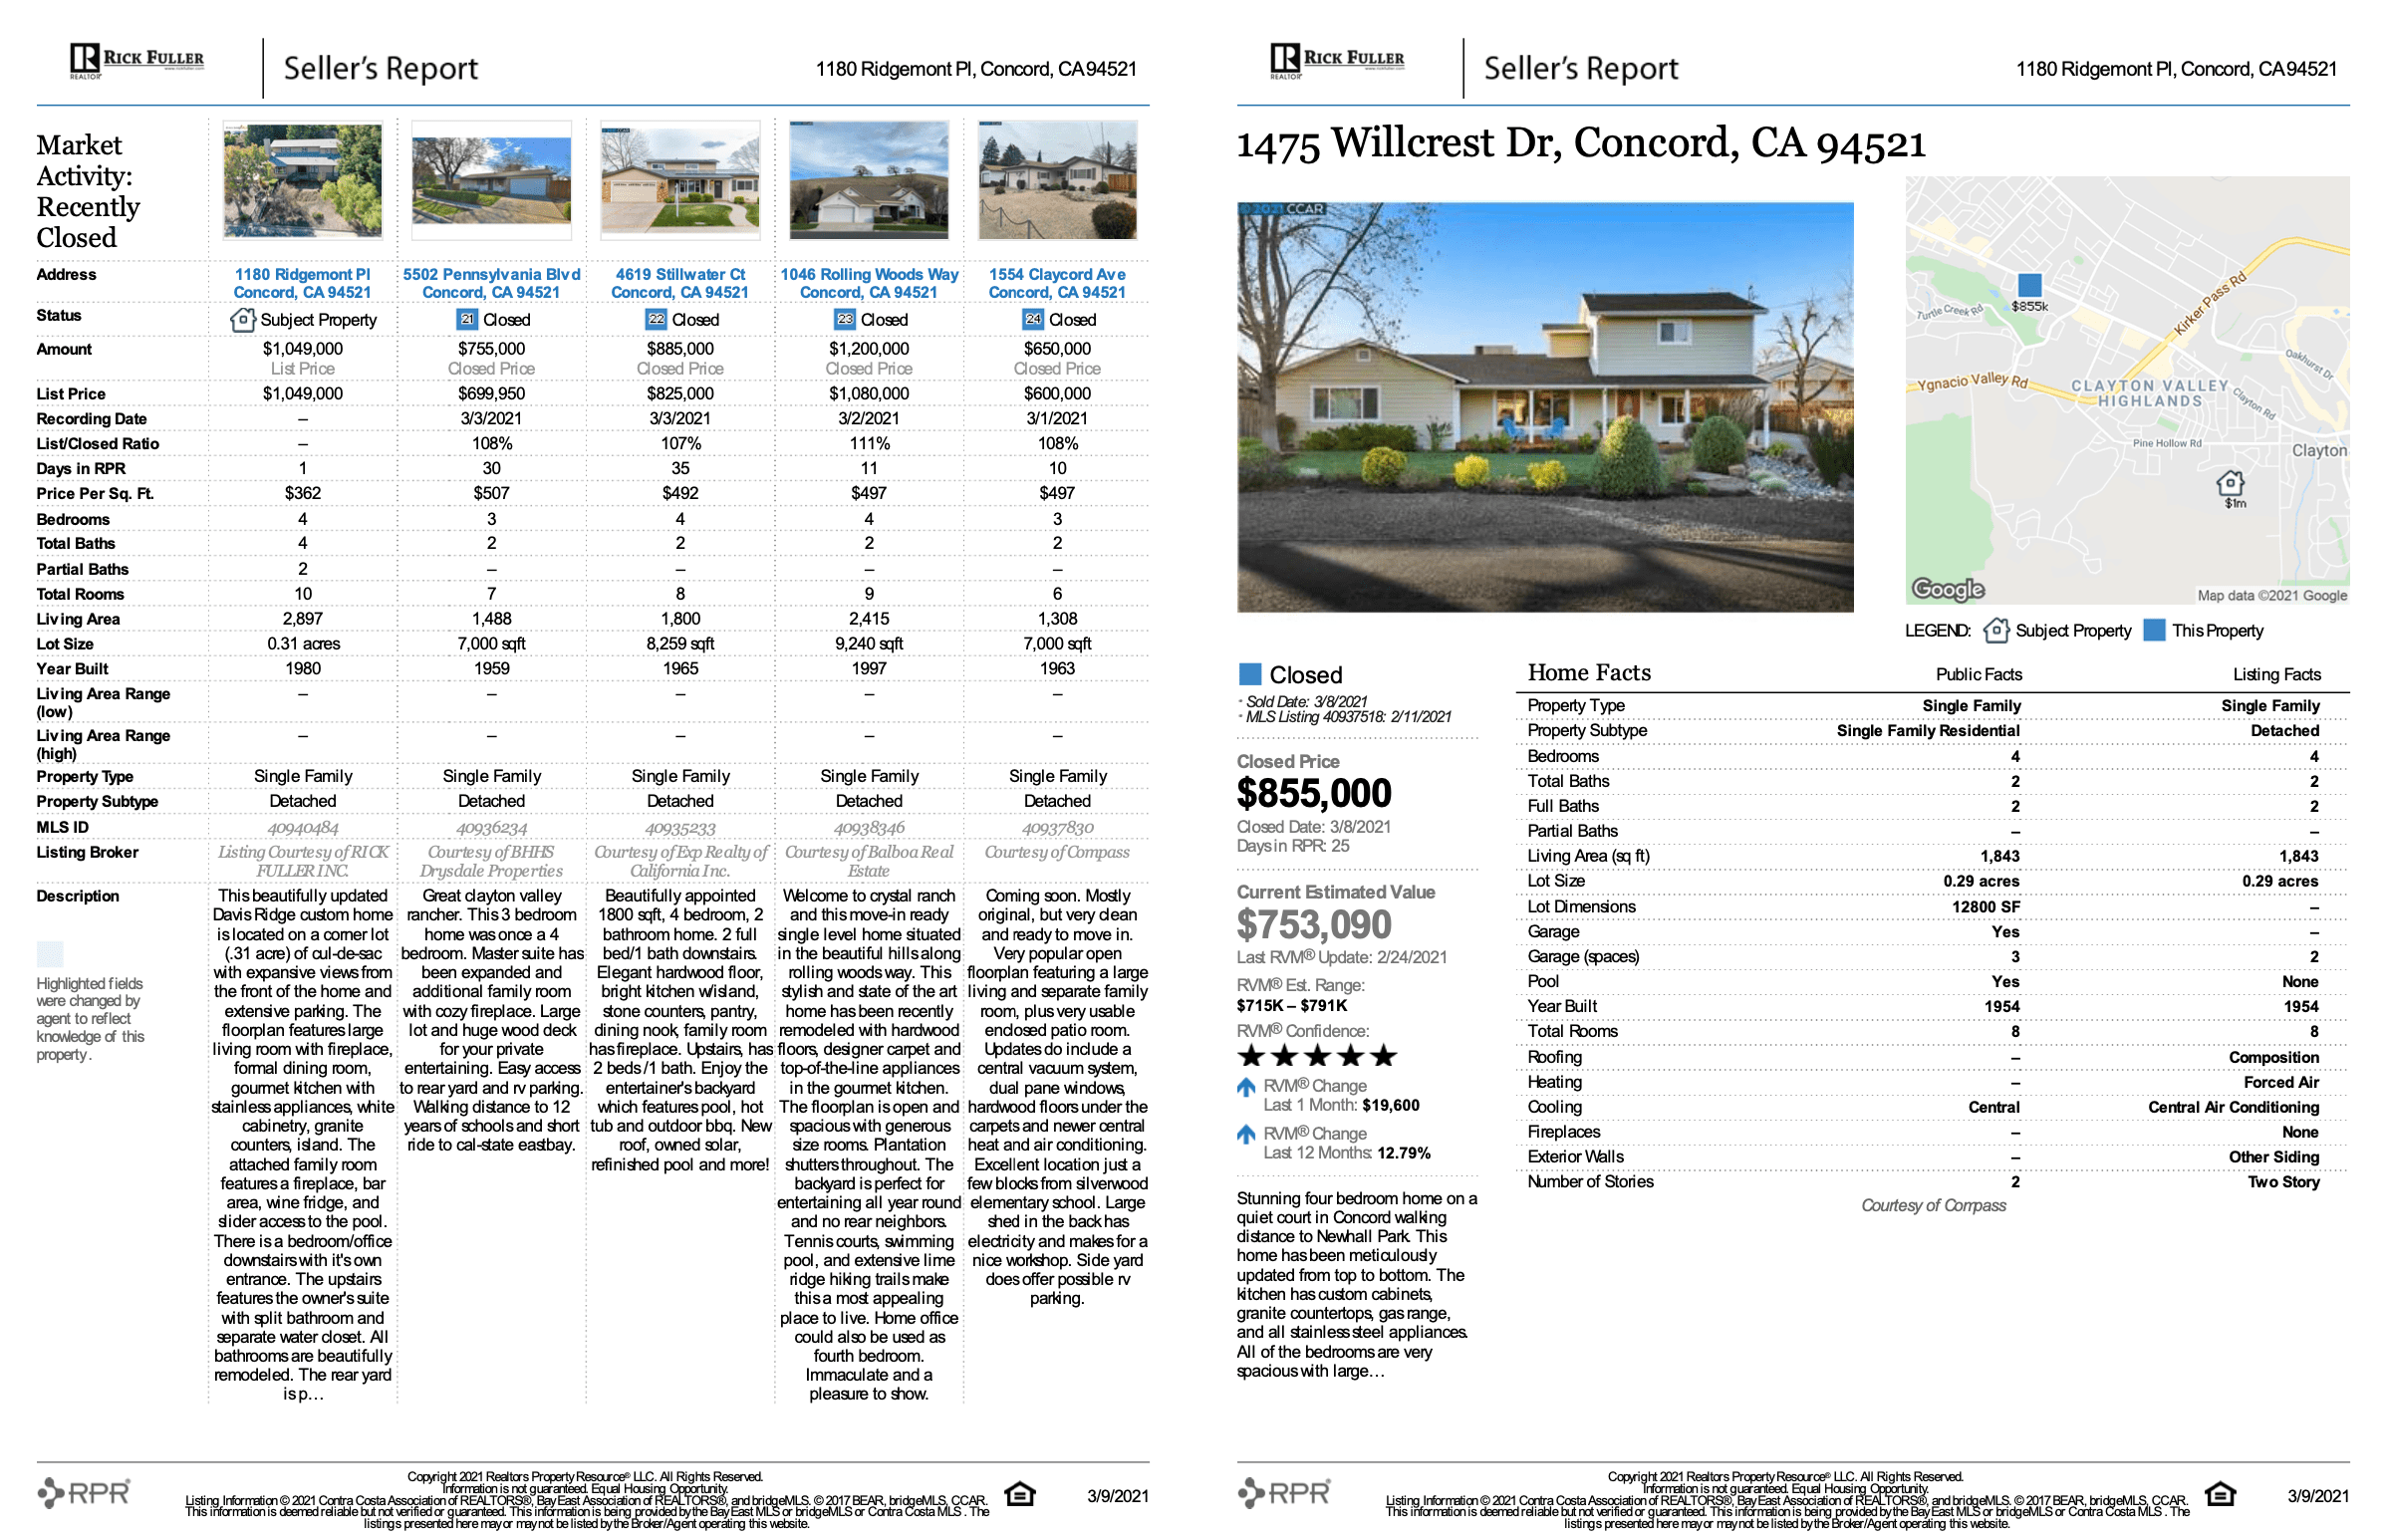
Closed properties
Closed properties are those that have recently sold in the area. Fuller tries to include similar, nearby homes that closed within the last six months. Again, he looks for properties that have similar square footage, amenities, and communities.
“Appraisers love the sold comparables, as they can be a great tool to assess the value of a property,” says Fuller. Closed comps also show the number of days on the market (DOM), which is a big indicator of the strength of the market. “If a home was on the market for a very short period of time, we know the market is likely very strong for sellers,” Fuller explains. “But if it took several months, that may indicate that the market is more in the buyers’ favor.”
Closed comps also provide the opportunity to compare the list-to-sell ratio to help gauge in which direction the market is going. If a house sold for above list price, that means it’s likely there were multiple offers, but if it sold for below list, that could be a sign that the market is on the decline.
However, it’s important to keep in mind that the sale price of a closed property can often be a little dated, because it may have been several months since the buyer initially wrote the offer. “Values have been appreciating throughout the country, so take into consideration that sold comparables may be significantly less,” notes Fuller.
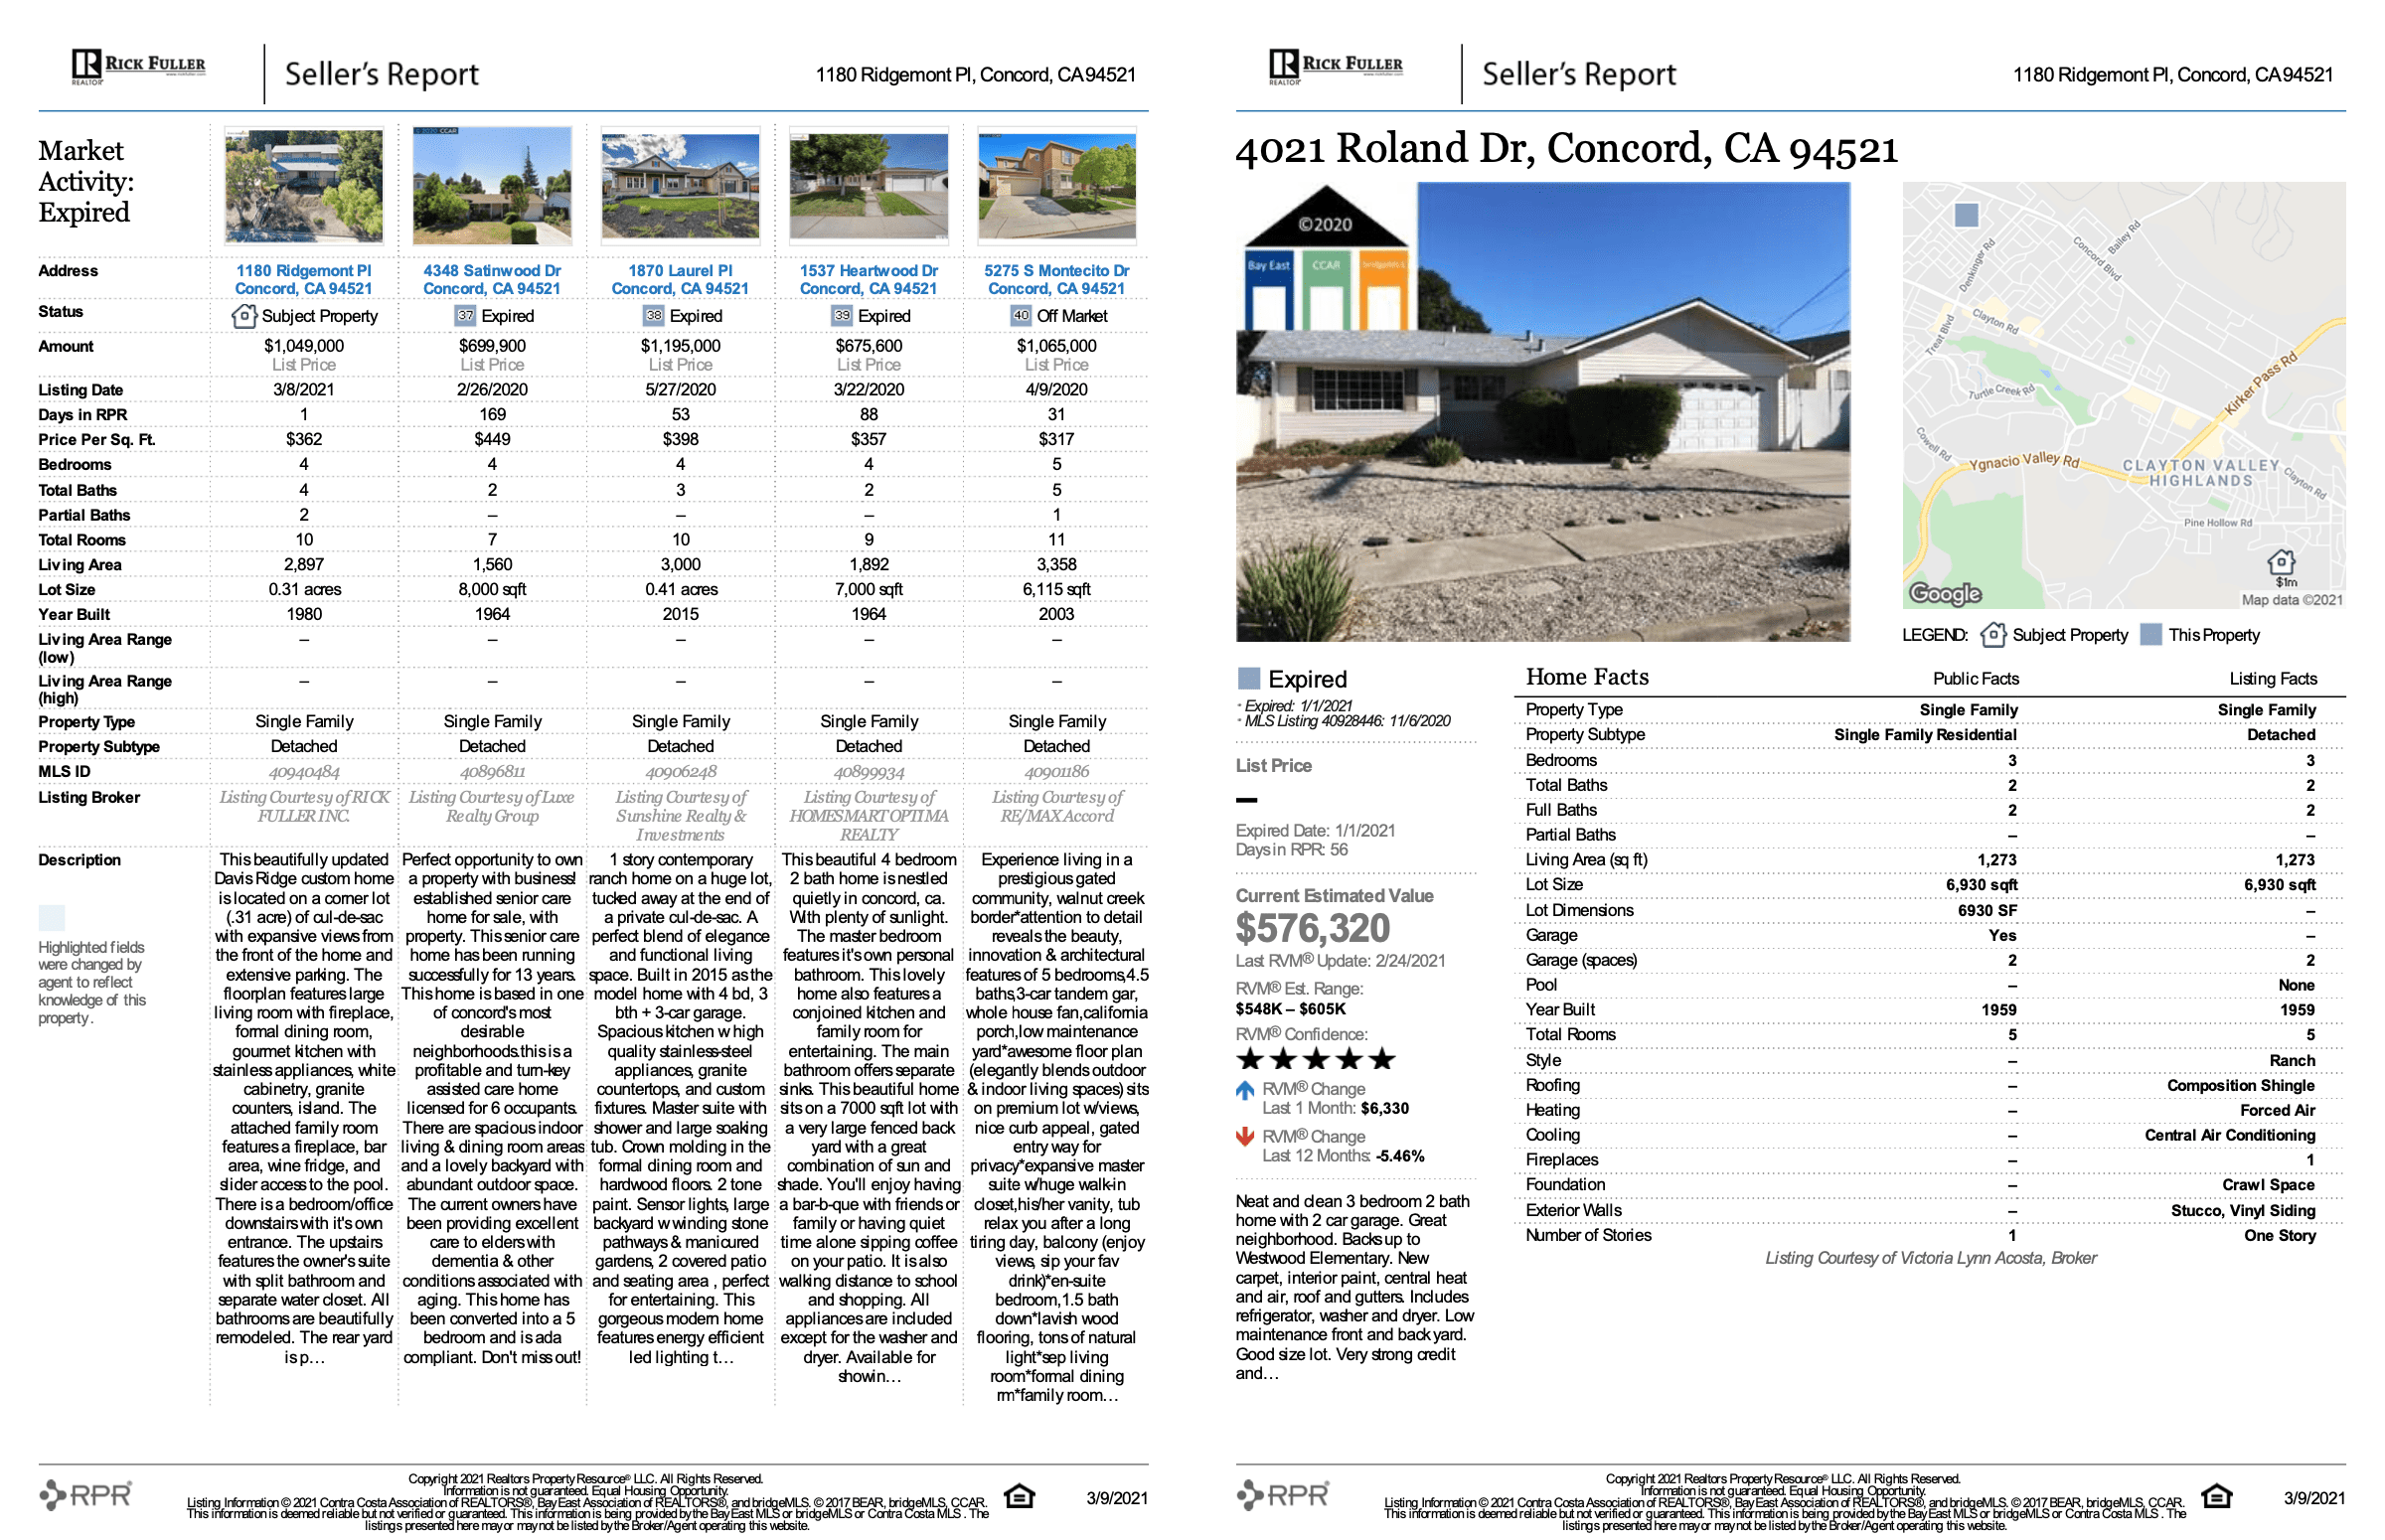
Expired properties
These are properties that were on the market at one time, but were then removed, possibly because they were listed at a too-high sale price and then failed to sell.
Fuller includes expired listings as sort of a cautionary tale. One of the common reasons that a property might not sell is that the price was too high. These withdrawn listings can help ensure that the subject property is realistically priced to prevent it from sitting on the market too long and ultimately getting removed.

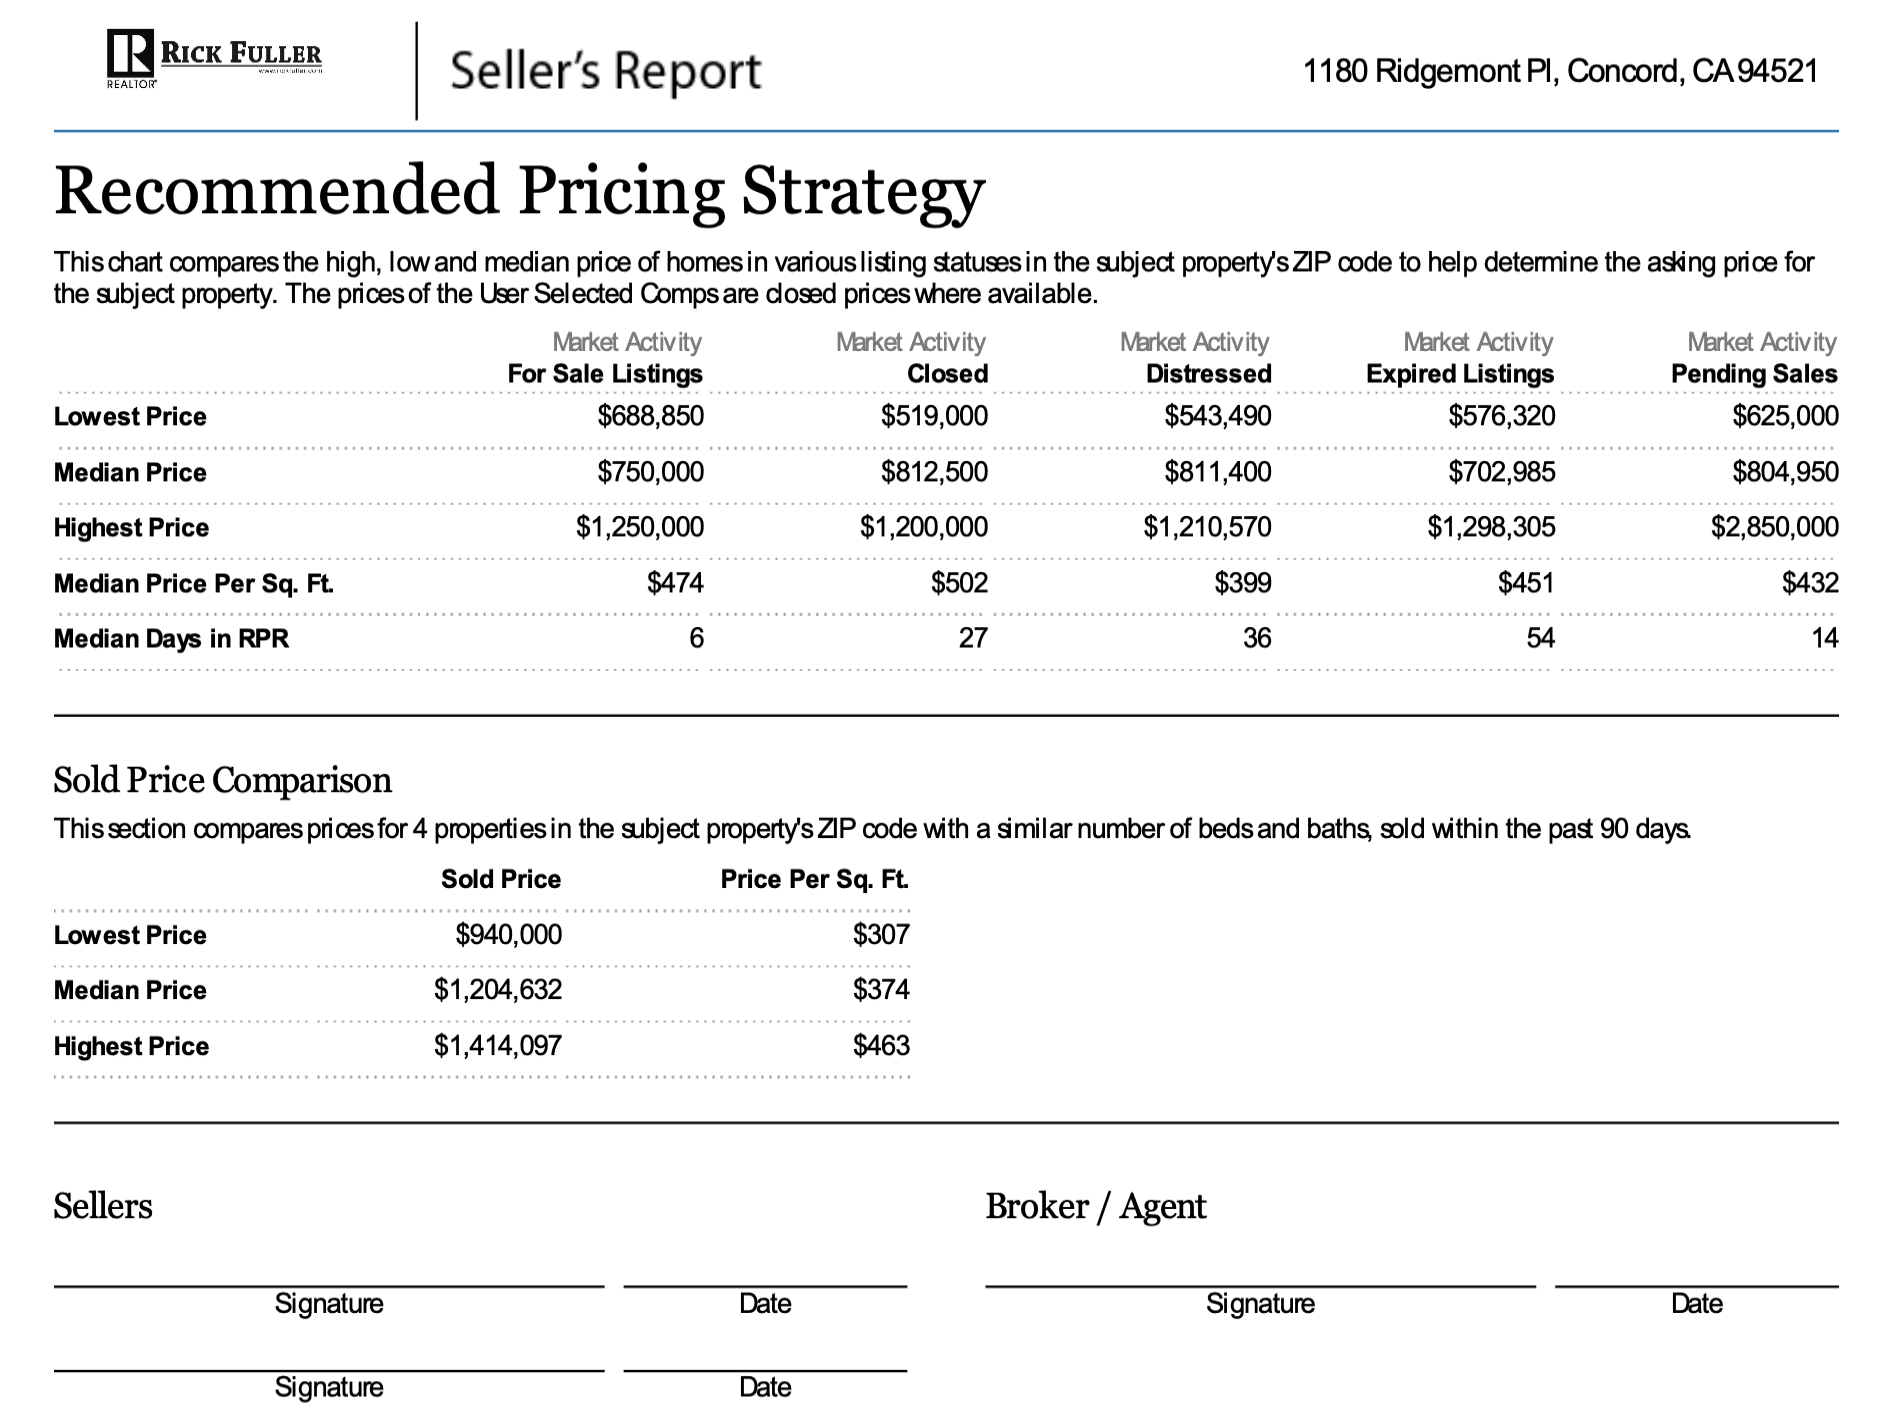
Recommended pricing strategy
At the end of the CMA, Fuller includes a recommended pricing strategy based on the high, low, and median prices of all of the active, pending, closed, distressed, and expired listings in the CMA. He also includes a sold price comparison of the high, median, and low sale prices for several nearby properties.
“All of the factors provided in the report culminate in a price range that is generally based on the improvements the seller is willing to make,” Fuller explains. “The more improvements they are willing to make, the closer to the top of the price range, and fewer improvements will be closer to the bottom of the price range.”
Seller’s proceeds
For the seller, the most important number is the amount of cash they’ll have after the sale closes. Some CMAs will include a worksheet to help the seller project how much their proceeds would be if the home sells at a low-end price and a high-end price, after deducting any mortgage balances, closing costs, concessions, and other fees.

A comparative market analysis can be highly instrumental in selling a home if it’s done right — but not all versions will have the same level of detail as the sample document we’ve shared here. As Fuller points out, the quality of a CMA is directly related to the experience and expertise of the real estate specialist who creates it. “The more knowledgeable the agent, the more accurate the CMA will be — and the more accurate the CMA is, the more likely the home will have the right list price,” he says. If you need to connect with a top real estate agent in your area who can treat your CMA with the utmost level of expertise, HomeLight would be happy to connect you.
Header Image Source: (StratfordProductions / Shutterstock)
At HomeLight, our vision is a world where every real estate transaction is simple, certain, and satisfying. Therefore, we promote strict editorial integrity in each of our posts.