
California Dominates the Hottest Real Estate Markets of 2017
- Published on
- 2-4 minute read
-
 Alexa Collins Contributing AuthorClose
Alexa Collins Contributing Author
Alexa Collins Contributing AuthorClose
Alexa Collins Contributing AuthorAlexa Collins has had her work featured by USA Today, Country Living, House Beautiful, Market Watch, and The San Jose Mercury News. Alexa has written about real estate for 3 years and has interviewed over 100 top real estate agents.
Home sale prices are up across the nation, and days on market for many cities continues to decrease. That means that in almost every market across the U.S., sellers hold all of the cards.
We saw this trend and decided to take a look at our data and find the hottest real estate markets across the U.S. Our goal was to figure out just how spicy these sellers markets are getting. What we found was crazy: our top 100 markets have a selling price increase of at least 10% from 2016 to 2017, and a days on market change of at least -10% from 2016 to 2017.
If you want to sell your home and you live in one of these markets, you’re in luck. Read on for a breakdown of our top 10 and see if you can find your city among the lucky 100 below.
Methodology
We sorted the hottest cities of 2017 by highest selling price, highest sale price percent increase from 2016 to 2017, and highest days on market percent decrease from 2016 to 2017. We then ranked these cities by highest selling price to get our overall 2017 winners. We used these three metrics because highest sale price, price increase, and days on market decrease gave us the best insight on which markets have the greatest demand for real estate right now. Highest price indicates desirability to live in that location; price increase indicates an increase in that desirability. The percent decrease of days on market (how fast homes are selling this year compared to last) indicates that homes are moving off the market quickly because of an increased demand. We combined these three numbers to get our top 100 real estate markets for 2017.
Key Findings
Out of the 100 cities on our top list, California took a whopping half and holds the first 20 spots. Silicon Valley cities and beach towns dominate the top 20, with sale prices ranging from well over to just under $1 million. Not only are California homes increasing in price, but steep competition from buyers continues to lower the days these homes sit on the market. The top 20 markets all have a days on market percent decrease of 11% or higher.
Silicon Valley and SoCal Beach Towns Win America’s Top 10 Hottest Real Estate Markets of 2017
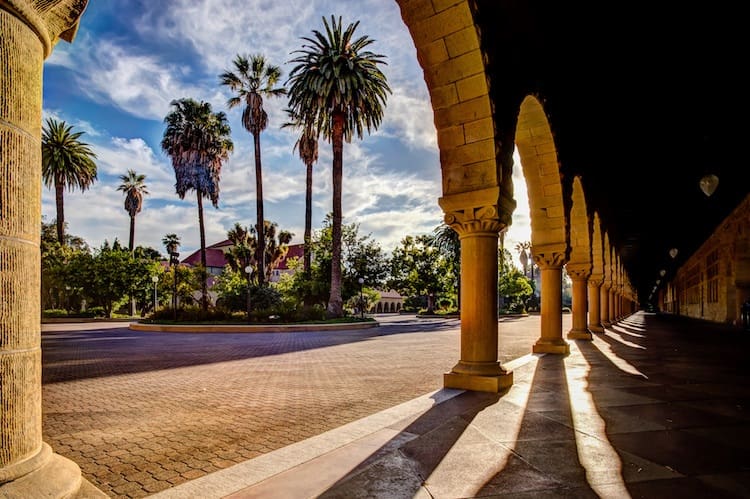
1. Palo Alto, California
Avg. Selling Price for 2017: $3,026,365.90
% Price Increase from 2016 to 2017: 15%
% Days on Market Decrease from 2016 to 2017: -20%
Home of Tesla and Stanford University, Palo Alto is a haven for tech families and college students alike. University Avenue, towering palm trees, and warm weather add to Palo Alto’s phenomenal location. Prices in Palo Alto rose 15% from last year, and the average selling price was a whopping $3 million. Better check on your home’s worth if you live in Palo Alto right now, because your house could fetch you some serious cash.

2. Los Altos, California
Avg. Selling Price for 2017: $2,992,249.25
% Price Increase from 2016 to 2017: 15%
% Days on Market Decrease from 2016 to 2017: -15%
Los Altos is another Silicon Valley city with a nature preserve running through it and a family friendly feel. Our second highest ranked city, Los Altos is often where commuters heading to work in the tech industry settle down. Like Palo Alto, Los Altos saw a 15% price increase from 2016.

3. Newport Beach, California
Avg. Selling Price for 2017: $2,523,478.69
% Price Increase from 2016 to 2017: 11%
% Days on Market Decrease from 2016 to 2017: -11%
If you’ve ever been to Newport Beach, you’ll know that it’s a beach town picturesque enough to be the setting of a romance novel. On Balboa Island, boats laze in the docs with American flags waving, and moms push strollers down the quiet and well kept streets. The charm comes with a pretty steep price tag. Coming in strong in our 3rd place position, homes in this Southern California beach town sold 11% faster this year than they did last just over $2.5 million.
4. Hermosa Beach, California
Avg. Selling Price for 2017: $2,183,029.45
% Price Increase from 2016 to 2017: 14%
% Days on Market Decrease from 2016 to 2017: -14%
Hermosa Beach sits in between two other Southern California beach havens: Redondo Beach and Manhattan Beach. Hermosa Beach is home to the Hermosa Beach pier, homes with gorgeous ocean views, and the Pacific Coast Highway. Hermosa Beach is the last city on our list with an average sale price of over $2 million.
5. Los Gatos, California
Avg. Selling Price for 2017: $1,994,901.70
% Price Increase from 2016 to 2017: 10%
% Days on Market Decrease from 2016 to 2017: -17%
Los Gatos is one of America’s wealthiest cities, so it makes sense that this Santa Clara County town ranks in the top ten of our hottest markets. The town has a charming town center with views of rolling green hills, and a days on market decrease of -17%.

6. Lafayette, California
Avg. Selling Price for 2017: $1,599,385.36
% Price Increase from 2016 to 2017: 11%
% Days on Market Decrease from 2016 to 2017: -34%
Lafayette has the highest days on market decrease in our entire top 10: days on market average decreased from 62 to 46, which is lightning fast. Lafayette is a quaint city in the East Bay of Northern California, with San Francisco across the Bay Bridge to the left and Walnut Creek to the right. Lafayette has a beautiful reservoir and recreation area, an adorable downtown, and a ton of cute houses.

7. Mountain View, California
Avg. Selling Price for 2017: $1,479,885.64
% Price Increase from 2016 to 2017: 13%
% Days on Market Decrease from 2016 to 2017: -23%
Mountain View, one of Silicon Valley’s busiest hubs, houses big names like Google, LinkedIn, and Microsoft. The city also houses Shoreline Amphitheatre, a huge concert venue next to Google’s campus. Mountain View homes are steadily increasing in price, with a 13% change from the last year.

8. Sunnyvale, California
Avg. Selling Price for 2017: $1,446,760.84
% Price Increase from 2016 to 2017: 13%
% Days on Market Decrease from 2016 to 2017: -21%
Sunnyvale has the overall lowest days on market for our entire top 100 list: homes in Sunnyvale only last 37 days. Not only does the city have the lowest days on market, the year over year change from 2016 is -21%. This Silicon Valley city is a densely populated hub, making it one of the top 7 Bay Area cities with the highest concentration of people.

9. Redwood City, California
Avg. Selling Price for 2017: $1,445,262.92
% Price Increase from 2016 to 2017: 10%
% Days on Market Decrease from 2016 to 2017: -27%
Redwood City is another tech hub: Box and Oracle both have headquarters there, among other large companies. Because of the hot job market, the housing market is hot here too. Homes sold 27% faster in Redwood City this year with a 10% increase in price.

10. Foster City, California
Avg. Selling Price for 2017: $1,363,533.93
% Price Increase from 2016 to 2017: 11%
% Days on Market Decrease from 2016 to 2017: -13%
Foster City is one of the safest areas in the United States, and it’s close to the Silicon Valley tech scene, which makes it a great city for families. The area is surrounded by water and has canals running through it, so you’ll find waterfront homes here.

The Overall Top 100 Real Estate Markets of 2017
| City, State | Sale Price 2017 | Price % Change (2016 to 2017) | Days on Market 2017 | Days on Market % Change |
| Palo Alto, California | $3,026,365.90 | 15% | 39.458159 | -20% |
| Los Altos, California | $2,992,249.25 | 15% | 38.77410468 | -15% |
| Newport Beach, California | $2,523,478.69 | 11% | 102.9885993 | -11% |
| Hermosa Beach, California | $2,183,029.45 | 14% | 75.04117647 | -14% |
| Los Gatos, California | $1,994,901.70 | 10% | 52.27394209 | -17% |
| Lafayette, California | $1,599,385.36 | 11% | 46.16564417 | -34% |
| Mountain View, California | $1,479,885.64 | 13% | 39.60227273 | -23% |
| Sunnyvale, California | $1,446,760.84 | 13% | 37.55228758 | -21% |
| Redwood City, California | $1,445,262.92 | 10% | 38.52981261 | -27% |
| Foster City, California | $1,363,533.93 | 11% | 41.30147059 | -13% |
| San Mateo, California | $1,307,748.81 | 13% | 44.09795479 | -15% |
| Campbell, California | $1,207,844.10 | 12% | 44.78359909 | -18% |
| Moraga, California | $1,194,675.01 | 16% | 46.4375 | -22% |
| Santa Clara, California | $1,085,911.64 | 13% | 40.90900196 | -18% |
| Rio del Mar, California | $1,024,963.96 | 10% | 71 | -22% |
| Fremont, California | $1,020,038.31 | 13% | 46.68111713 | -19% |
| Walnut, California | $997,763.91 | 15% | 77.48130841 | -23% |
| Pismo Beach, California | $992,775.74 | 11% | 101.2519084 | -18% |
| Hacienda Heights, California | $942,885.00 | 70% | 82.15483871 | -11% |
| Cottage Lake, Washington | $913,304.43 | 15% | 58.0754717 | -24% |
| Newcastle, Washington | $904,319.26 | 24% | 71.01935484 | -24% |
| Azusa, California | $896,606.09 | 105% | 80.9469697 | -13% |
| Union Hill-Novelty Hill, Washington | $881,943.35 | 11% | 58.0528169 | -14% |
| San Bruno, California | $871,629.90 | 10% | 44.84149856 | -20% |
| El Cerrito, California | $848,635.79 | 19% | 51.34965035 | -38% |
| Daly City, California | $846,262.10 | 11% | 52.48859935 | -12% |
| Torrance, California | $844,662.07 | 12% | 60.24914286 | -20% |
| Kirkland, Washington | $812,382.88 | 14% | 55.94594595 | -20% |
| Poway, California | $802,140.62 | 11% | 69.00221729 | -11% |
| Castro Valley, California | $786,691.13 | 10% | 52.7305296 | -20% |
| Newark, California | $763,864.64 | 11% | 47.92600423 | -24% |
| Redmond, Washington | $763,161.67 | 16% | 62.99241275 | -30% |
| Seattle, Washington | $755,553.00 | 14% | 49.20397471 | -45% |
| Issaquah, Washington | $726,138.96 | 20% | 66.58401305 | -17% |
| Live Oak, California | $716,312.86 | 32% | 62.3129771 | -44% |
| San Gabriel, California | $704,971.84 | 10% | 72.11643836 | -15% |
| Vashon, Washington | $656,569.36 | 25% | 66.55045872 | -27% |
| Hayward, California | $614,496.22 | 11% | 52.28329092 | -25% |
| East Renton Highlands, Washington | $607,551.31 | 16% | 59.5942029 | -43% |
| Artondale, Washington | $596,198.43 | 15% | 87.65925926 | -40% |
| Edmonds, Washington | $590,520.08 | 13% | 54.45889101 | -16% |
| Clarendon Hills, Illinois | $583,956.12 | 15% | 107.8717949 | -10% |
| Lake San Marcos, California | $578,895.22 | 14% | 55.59504132 | -33% |
| Seaside, California | $561,316.76 | 19% | 73.5 | -16% |
| Duvall, Washington | $550,676.67 | 15% | 57.15942029 | -19% |
| Freeland, Washington | $547,254.79 | 17% | 101.587156 | -26% |
| Deerfield, Illinois | $543,693.52 | 11% | 107.0096154 | -13% |
| Mill Creek, Washington | $533,214.55 | 11% | 72.46645367 | -10% |
| Greensboro, North Carolina | $532,753.54 | 187% | 103.9076087 | -16% |
| Mukilteo, Washington | $529,909.90 | 13% | 63.96923077 | -23% |
| Pinole, California | $528,362.96 | 10% | 58.10869565 | -12% |
| Watsonville, California | $524,574.86 | 21% | 76.03333333 | -16% |
| La Grange, Illinois | $506,567.46 | 18% | 94.9 | -15% |
| Santa Ana, California | $501,634.03 | 13% | 77.67375231 | -14% |
| Vista, California | $499,124.76 | 10% | 65.80589681 | -27% |
| Oakley, California | $497,864.05 | 11% | 58.3219697 | -16% |
| Silver Firs, Washington | $486,718.90 | 11% | 58.71779141 | -30% |
| Stanton, California | $473,737.52 | 19% | 63.03333333 | -27% |
| Bryn Mawr-Skyway, Washington | $469,942.66 | 24% | 59.09174312 | -27% |
| Inglewood, California | $468,791.32 | 13% | 67.28888889 | -44% |
| Tracy, California | $460,920.17 | 10% | 63.97492163 | -16% |
| Eastmont, Washington | $460,549.24 | 11% | 67.50872093 | -24% |
| Lake Arrowhead, California | $439,254.19 | 12% | 133.9801762 | -20% |
| Camano, Washington | $438,632.15 | 16% | 95.88118812 | -15% |
| Littleton, Colorado | $437,122.64 | 12% | 53.94954955 | -10% |
| Antioch, California | $430,186.88 | 12% | 58.07222222 | -20% |
| Burien, Washington | $430,138.60 | 11% | 60.19426049 | -25% |
| Edgewood, Washington | $427,069.67 | 11% | 91.73652695 | -11% |
| Fort Collins, Colorado | $416,130.56 | 16% | 64.28648649 | -28% |
| East Los Angeles, California | $415,383.54 | 12% | 83.81012658 | -16% |
| Wildomar, California | $413,293.08 | 13% | 85.04514673 | -14% |
| Cavalero, Washington | $405,004.42 | 11% | 55.52727273 | -31% |
| Snohomish, Washington | $404,701.36 | 12% | 88.53403141 | -14% |
| Maitland, Florida | $402,635.22 | 14% | 101.5424528 | -16% |
| Winter Gardens, California | $399,858.99 | 10% | 59.45323741 | -24% |
| White Center, Washington | $396,489.77 | 11% | 58.97794118 | -52% |
| Bellingham, Washington | $393,754.49 | 11% | 66.21059603 | -31% |
| West Rancho Dominguez, California | $390,906.65 | 14% | 78.83870968 | -23% |
| Firestone, Colorado | $386,423.28 | 10% | 68.98969072 | -10% |
| North Druid Hills, Georgia | $386,010.22 | 11% | 66.43811395 | -14% |
| Lake Barrington, Illinois | $385,509.35 | 12% | 131.1239669 | -15% |
| Lake Stevens, Washington | $385,310.79 | 13% | 81.38509317 | -18% |
| Santa Maria, California | $383,420.58 | 11% | 78.97590361 | -29% |
| Laguna Woods, California | $382,123.27 | 12% | 87.81325301 | -11% |
| Port Townsend, Washington | $381,846.26 | 12% | 96.232 | -31% |
| Lakeland North, Washington | $379,973.34 | 17% | 66.31351351 | -24% |
| Loveland, Colorado | $376,007.45 | 11% | 72.44505495 | -16% |
| Downers Grove, Illinois | $365,357.43 | 11% | 86.26957831 | -21% |
| Sudden Valley, Washington | $359,081.53 | 12% | 63.76744186 | -46% |
| Holly Springs, North Carolina | $356,814.58 | 11% | 87.6092437 | -25% |
| Kent, Washington | $356,799.09 | 11% | 75.26745098 | -11% |
| Rotonda, Florida | $355,464.35 | 11% | 130.5773525 | -16% |
| Flat Rock, North Carolina | $354,122.54 | 10% | 152.1636364 | -10% |
| Geneva, Illinois | $349,291.93 | 10% | 91.45625 | -22% |
| Paramount, California | $348,482.07 | 11% | 73.8 | -41% |
| Florence-Graham, California | $344,943.74 | 16% | 92.19444444 | -16% |
| Pittsboro, North Carolina | $342,889.25 | 12% | 127.4207317 | -18% |
| Federal Way, Washington | $334,172.05 | 11% | 72.83240223 | -12% |
| Summit View, Washington | $333,934.50 | 11% | 120.0944444 | -12% |
At HomeLight, our vision is a world where every real estate transaction is simple, certain, and satisfying. Therefore, we promote strict editorial integrity in each of our posts.